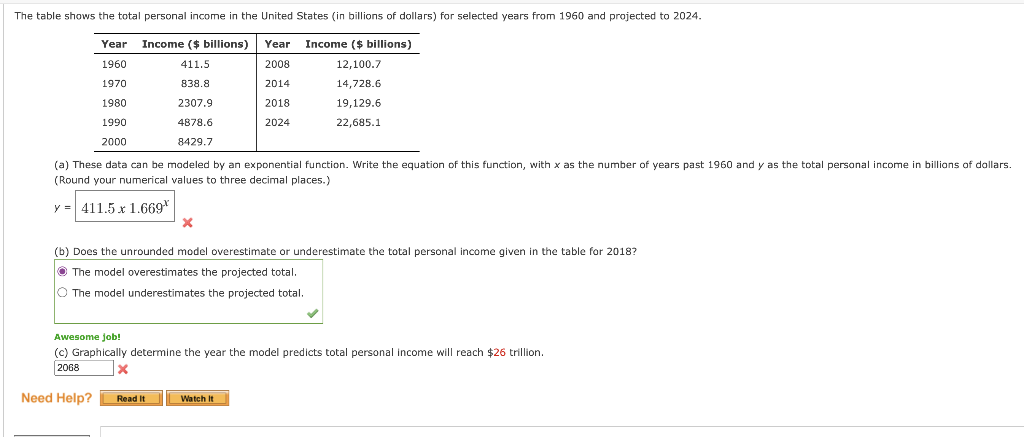
The table shows the total personal income in the United States (in billions of dollars) for selected years from 1960 and projected to 2024. Year Income ($ billions) Year Income ($ billions) 1960 2008 12,100.7 1970 2014 14,728.6 19,129.6 22,685.1 1980 1990 2000 411.5 838.8 2307.9 4878.6 8429.7 (a) These data can be modeled by an exponential function. Write the equation of this function, with x as the number of years past 1960 and y as the total personal income in billions of dollars. (Round your numerical values to three decimal places.) y = 411.5 x 1.669 X Read It X (b) Does the unrounded model overestimate or underestimate the total personal income given in the table for 2018? The model overestimates the projected total. O The model underestimates the projected total. 2018 2024 Awesome job! (c) Graphically determine the year the model predicts total personal income will reach $26 trillion. 2068 Need Help? Watch It
The table shows the total personal income in the United States (in billions of dollars) for selected years from 1960 and projected to 2024. Year Income ($ billions) Year Income ($ billions) 1960 2008 12,100.7 1970 2014 14,728.6 19,129.6 22,685.1 1980 1990 2000 411.5 838.8 2307.9 4878.6 8429.7 (a) These data can be modeled by an exponential function. Write the equation of this function, with x as the number of years past 1960 and y as the total personal income in billions of dollars. (Round your numerical values to three decimal places.) y = 411.5 x 1.669 X Read It X (b) Does the unrounded model overestimate or underestimate the total personal income given in the table for 2018? The model overestimates the projected total. O The model underestimates the projected total. 2018 2024 Awesome job! (c) Graphically determine the year the model predicts total personal income will reach $26 trillion. 2068 Need Help? Watch It

Algebra & Trigonometry with Analytic Geometry
13th Edition
ISBN:9781133382119
Author:Swokowski
Publisher:Swokowski
Chapter10: Sequences, Series, And Probability
Section10.2: Arithmetic Sequences
Problem 67E

Related questions
Question
Transcribed Image Text:The table shows the total personal income in the United States (in billions of dollars) for selected years from 1960 and projected to 2024.
Year Income ($ billions) Year
Income ($ billions)
1960
2008
12,100.7
1970
2014
14,728.6
19,129.6
22,685.1
1980
1990
2000
411.5
838.8
2307.9
4878.6
8429.7
(a) These data can be modeled by an exponential function. Write the equation of this function, with x as the number of years past 1960 and y as the total personal income in billions of dollars.
(Round your numerical values to three decimal places.)
y = 411.5 x 1.669
X
Read It
X
(b) Does the unrounded model overestimate or underestimate the total personal income given in the table for 2018?
The model overestimates the projected total.
O The model underestimates the projected total.
2018
2024
Awesome job!
(c) Graphically determine the year the model predicts total personal income will reach $26 trillion.
2068
Need Help?
Watch It
Expert Solution
This question has been solved!
Explore an expertly crafted, step-by-step solution for a thorough understanding of key concepts.

This is a popular solution!

Trending now
This is a popular solution!

Step by step
Solved in 5 steps with 4 images

Recommended textbooks for you
Algebra & Trigonometry with Analytic Geometry
Algebra
ISBN:
9781133382119
Author:
Swokowski
Publisher:
Cengage

Linear Algebra: A Modern Introduction
Algebra
ISBN:
9781285463247
Author:
David Poole
Publisher:
Cengage Learning

Algebra & Trigonometry with Analytic Geometry
Algebra
ISBN:
9781133382119
Author:
Swokowski
Publisher:
Cengage
Linear Algebra: A Modern Introduction
Algebra
ISBN:
9781285463247
Author:
David Poole
Publisher:
Cengage Learning

Glencoe Algebra 1, Student Edition, 9780079039897…
Algebra
ISBN:
9780079039897
Author:
Carter
Publisher:
McGraw Hill