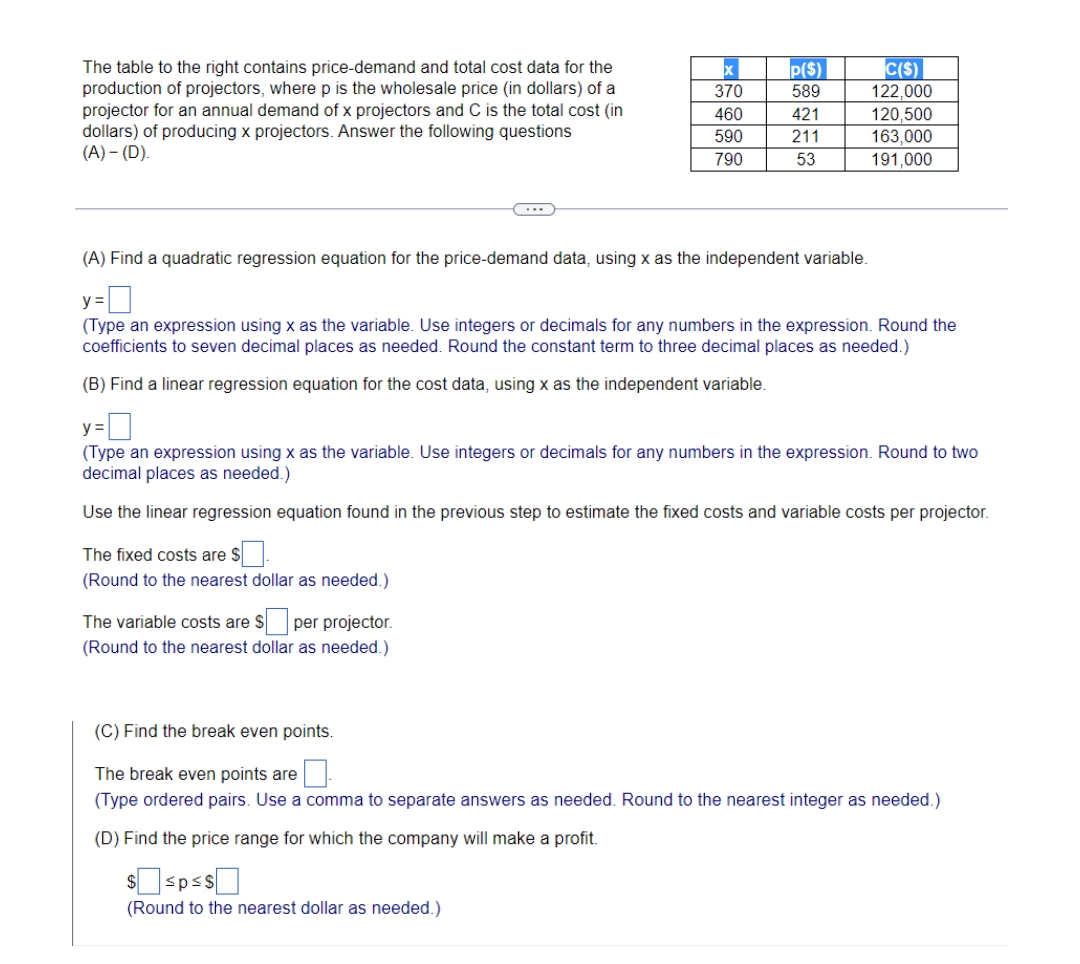
The table to the right contains price-demand and total cost data for the production of projectors, where p is the wholesale price (in dollars) of a projector for an annual demand of x projectors and C is the total cost (in dollars) of producing x projectors. Answer the following questions (A) - (D). 370 460 590 790
The table to the right contains price-demand and total cost data for the production of projectors, where p is the wholesale price (in dollars) of a projector for an annual demand of x projectors and C is the total cost (in dollars) of producing x projectors. Answer the following questions (A) - (D). 370 460 590 790

Algebra & Trigonometry with Analytic Geometry
13th Edition
ISBN:9781133382119
Author:Swokowski
Publisher:Swokowski
Chapter9: Systems Of Equations And Inequalities
Section9.4: Linear Programming
Problem 1E

Related questions
Question
Transcribed Image Text:X
p($)
C($)
370
589
122,000
The table to the right contains price-demand and total cost data for the
production of projectors, where p is the wholesale price (in dollars) of a
projector for an annual demand of x projectors and C is the total cost (in
dollars) of producing x projectors. Answer the following questions
(A) - (D).
460
421
120,500
590
211
163,000
790
53
191,000
(A) Find a quadratic regression equation for the price-demand data, using x as the independent variable.
y =
(Type an expression using x as the variable. Use integers or decimals for any numbers in the expression. Round the
coefficients to seven decimal places as needed. Round the constant term to three decimal places as needed.)
(B) Find a linear regression equation for the cost data, using x as the independent variable.
y=0
(Type an expression using x as the variable. Use integers or decimals for any numbers in the expression. Round to two
decimal places as needed.)
Use the linear regression equation found in the previous step to estimate the fixed costs and variable costs per projector.
The fixed costs are $
$.
(Round to the nearest dollar as needed.)
The variable costs are $ per projector.
(Round to the nearest dollar as needed.)
(C) Find the break even points.
The break even points are
(Type ordered pairs. Use a comma to separate answers as needed. Round to the nearest integer as needed.)
(D) Find the price range for which the company will make a profit.
$≤p≤$
sps
(Round to the nearest dollar as needed.)
Expert Solution
This question has been solved!
Explore an expertly crafted, step-by-step solution for a thorough understanding of key concepts.

This is a popular solution!

Trending now
This is a popular solution!

Step by step
Solved in 3 steps with 2 images

Recommended textbooks for you
Algebra & Trigonometry with Analytic Geometry
Algebra
ISBN:
9781133382119
Author:
Swokowski
Publisher:
Cengage
Algebra & Trigonometry with Analytic Geometry
Algebra
ISBN:
9781133382119
Author:
Swokowski
Publisher:
Cengage