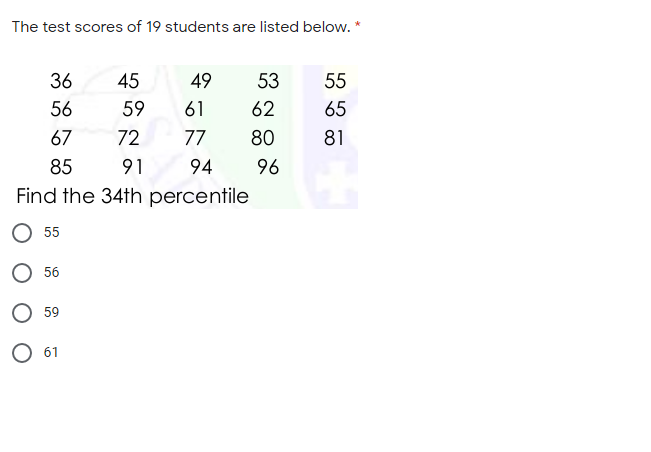
The test scores of 19 students are listed below. * 36 45 49 53 55 56 59 61 62 65 67 72 77 80 81 85 91 94 96 Find the 34th percentile 55 O 56 59 61


Q: Find the indicated percentile, decile, or quartile. The test scores of 32 students are listed…
A:
Q: he test scores of 40 students are listed below. Construct a boxplot for the data set. 25 35 43 44…
A: From given data, Population size: 40Median: 72Minimum: 25Maximum: 98First quartile: 57.5Third…
Q: A class of eleven people received the test scores shown below, sorted by score. 32 51 69 73 74 75 82…
A: The data is arranged in ascending order.
Q: The boxplot below shows the distribution of heights of 16 undergraduate statistics students. Using…
A: we have to interperete the boxplot
Q: Below are exam scores from a statistics class with 25 students: 100, 88, 90, 72, 76, 64, 68, 60, 78,…
A: From the provided information, Sample size (n) = 25 The number of students who scored above a 60 is…
Q: LeBron James' scores in the last 2018 NBA finals are as follows: 35 46 31 44 29 42 17 27 35. What is…
A: Given dataset is : 35,46,31,44,29,42,17,27,35
Q: A class of eleven people received the test scores shown below, sorted by score. 32 51 69 73 74 75 82…
A: Given data set is 32,51,69,73,74,75,82,89,93,98,100 n=No. of observation=11
Q: Find the first quartile for this list of numbers 12 81 98 10 55 83 85 34 31 8 53 74 76 58 Quartile 1…
A: Given data is12,98,10,83,34,8,74,58,81,5,55,85,31,53,76Arrange the given data in ascending order5 ,…
Q: A local Doctors Office recorded the wait times for 70 patients on a Saturday afternoon and organized…
A: The lowest and highest observation value that is present in the data-set is known as the minimum and…
Q: The students in Hugh Logan's math class took the Scholastic Aptitude Test. Their math scores are…
A:
Q: The test scores of 20 students are listed below. Find the 34th percentile
A: We have to find the 34th percentile from the given data set.
Q: Listed are 32 ages for Academy Award winning best actors in order from smallest to largest. (Round…
A:
Q: The test scores of 40 students are listed below. Find P56. 30 35 43 44 47 48 54 55 56 57 59 62 63 65…
A: percentile is a generalized form of the quartiles. it can be defines as the value below which a…
Q: g the sample paired data below, determine a 59 45 33 65 37 41 46 42 0.07 to 1.47
A: Note: As the image of the question is blurred so kindly confirm the input data. By applying a paired…
Q: Find the 44th percentile, P44, from the following data 1 6 7 8 9 11 14 17 18 21 25 26 33 34 35 36 37…
A: The given data is already arranged in ascending order.sample size(n)=35
Q: Listed are 29 ages for Academy Award winning best actors in order from smallest to largest. 18; 21;…
A: Calculate Percentiles-40,Percentiles-78 from the following…
Q: 3) Listed are 29 ages for Academy Award winning best actors in order from smallest to largest.…
A: As per our guidelines we are suppose to answer only one question. given data is already arranged in…
Q: The test scores of 40 students are listed below. Find P56- Find the percentile for the test score of…
A: The given sorted data set is, 30, 35, 43, 44, 47, 48, 54, 55, 56, 57, 59, 62, 63, 65, 66, 68, 69,…
Q: A statistics class with 60 students were given an examination and the results are shown below. 88 47…
A: First we arrange the data set in ascending order so it would be easy to count the frequencies for…
Q: d the 74th percentile, P74, from the following data 3 7 12 17 23 25 28 29 36 38 44 51 63 66 67 72 75…
A: Given : Sample size (n)=22 3 7 12 17 23 25 28 29 36 38 44 51 63 66 67 72 75 83 85 91 99…
Q: The test scores of 10 randomly selected students are listed below. Find the median. 30 35 43 44 47…
A:
Q: What is the relationship between the attendance at a major league ball game and the total number of…
A: Given, Attendence(X) Runs(Y) 47 10 39 6 50 11 48 10 51 11 35 9 34 9 38 6 47 6…
Q: The Test scores of ten students are listed below. Find the median score. 71 67 67 72 76 72 73 68 72…
A:
Q: Find the 24th percentile, P24, from the following data 4 5 6 10 11 15 16 19 20 24 26 34 37 39 41 43…
A: Consider the given data. Let k='k'th percentile=24 i=Index ranking or position n=Total number of…
Q: The test scores of 15 students are listed below. Find the 25th percentile of students' test scores.…
A: Given information- We have given the test score of 15 students listed below. 40, 45, 50, 56, 58, 63,…
Q: Find the indicated measure. 8) The test scores of 40 students are listed below. Find P85. 30 35 43…
A: Given information- We have given the test scores of 40 students, which are listed below- We have to…
Q: Construct a boxplot as requested. 15) The test scores of 40 students are listed below. Construct a…
A: Given,n= 40Min. Value is 25Q1→1st quartile = 25thpercentileL25 = (n+1) x 25100= 41 x 0.25 = 10.25Q1…
Q: Obtain the five-number summary for the given data. The test scores of 15 students are listed below.…
A: Five- number summary, Minimum, Q1, Median,Q3 Maximum. Here minimum= 43 And maximum= 95
Q: Listed are 32 ages for Academy Award winning best actors in order from smallest to largest. (Round…
A: Listed are 32 ages for Academy Award winning best actors in order from smallest to largest. 18; 18;…
Q: Listed are 32 ages for Academy Award winning best actors in order from smallest to largest. (Round…
A: Given Data…
Q: The test scores of 30 students are listed below. Find P81 31 41 45 48 52 55 56 56 63 65 67 67 69 70…
A: The data are given, first we arrange the data into ascending order,
Q: The test scores of 40 students are listed below. Find P56. 30 35 43 44 47 48 54 55 56 57 62 63 65 66…
A: Note: If "L" is a whole number, then the value of the kth percentile is the midway between Lth…
Q: A boxplot for a set of 28 scores is given below. 6 7 9 10 11 12 13 DATA How many scores are…
A:
Q: The scores of the top ten finishers in a recent golf tournament are listed below. Find the mean…
A: According to the given information, we have Data set: 71, 67, 67, 72, 76, 72, 73, 68, 72, 72 Total…
Q: Below are the ages of ten women who have been recognized for their social work:…
A:
Q: Find the 94th percentille, P, from the following data 1|13 15 21 42 45 50 52 56 62 64 74 75 81 65 67…
A:
Q: 3. What is the value that corresponds to the 60th percentile in the following data set? Use linear…
A: The question is about measures Given Data :
Q: Find the 24th percentile, P24, from the following data 2 9 10 11 13 14 16 22 23 24 25 26 27 37 38 39…
A: Arranging Observations in the ascending order, We get…
Q: Find the 14th percentile, P14, from the following data 12 15 16 18 28 29 32 33 39 47 55 56 57 58 62…
A: Given that: The data are 5, 6, 12, 15, 16, 18, 28, 29, 32, 33, 39, 47, 55, 56, 57, 58, 62, 68, 73,…
Q: Find the 54th percentile, P54, from the following dața 10 13 14 18 21 24 25 26 27 28 30 34 35 37 38…
A: Given that. The data are…
Q: Find 80th percentile, P80, from the following data 130 170 210 240 260 320 330 350 420 480 610 630…
A: Arrange data in accending order 130, 170, 210, 240, 260, 320, 330, 350, 420, 480, 610, 630, 640,…
Q: The test scores of 40 students are listed below find P 56 30 35 43 44 47 48 54 55 56 57 59 62 63…
A: From the provided information, Total number of observations = 40 The values are in ascending order.
Q: The median of the test scores given in the figure below is: Stem Leaves 667 2359 7 0011689 8 11568…
A: Given that, Number of observations = 25
Q: Find the 24th percentile, P24, from the following data 6 10 17 28 30 32 33 35 38 39 43 56 57 63 65…
A:
Q: Listed are 32 ages for Academy Award winning best actors in order from smallest to largest. 18; 18;…
A: Percentile : Percentile indicates that the percentage of scores that follow below a particular…
Q: A group of people was randomly selected and asked how many hours per day each person spends on…
A: To find: What percentage of the people surveyed spend 5 hours or more per day on social media?
Q: Obtain the five-number summary for the given data. The test scores of 15 students are listed below.…
A: The five number summary is minimum, first quartile, median, third quartile and maximum.
Q: Find the 34th percentile, P34, from the following data 1 3 7 11 12 20 26 28 37 40 41 43 46 47 51 52…
A: Formula used for 34th percentile. P34=(34(n+1)/100)th
Q: Find the upper quartile of the following set scores: 1, 3, 4, 5, 6, 8, 11, 13, 17
A:
Q: Consider the dataset below. 44 72 74 78 102 Find the percentile rank of 44
A: Since given data is already in ascending order We don't need to arrange it 44 , 72 , 74 , 78 , 102…


Trending now
This is a popular solution!

Step by step
Solved in 2 steps
