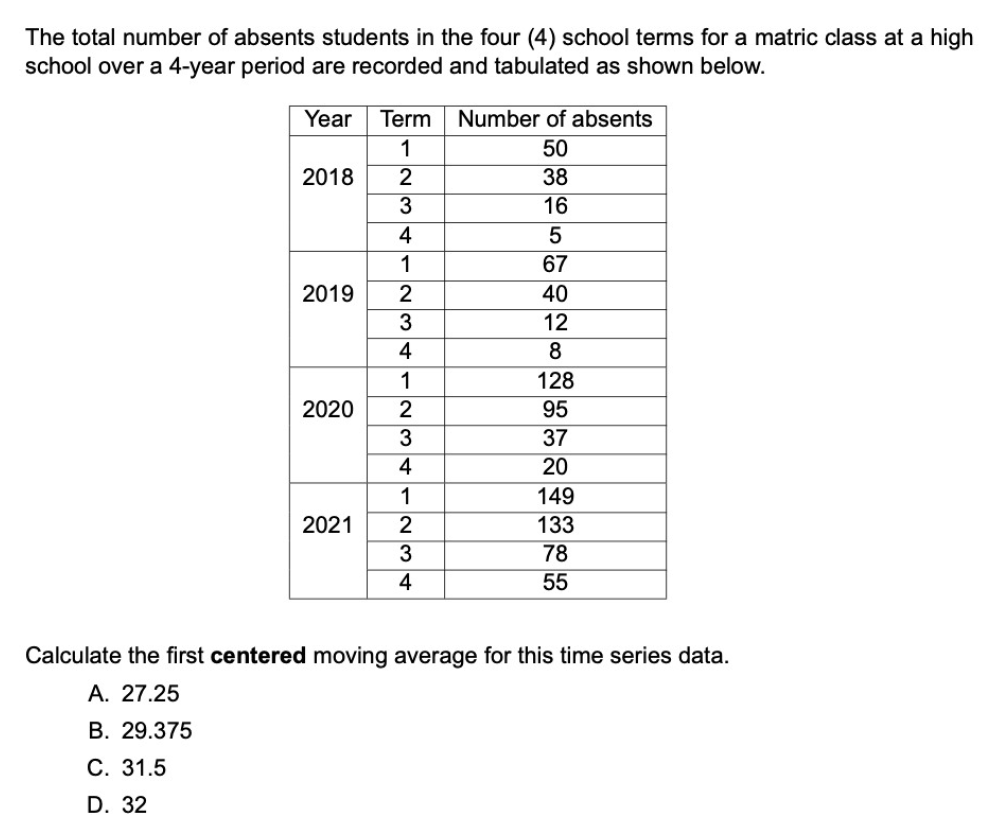
The total number of absents students in the four (4) school terms for a matric class at a high school over a 4-year period are recorded and tabulated as shown below. Year Term Number of absents 1 50 2018 2 38 3 16 4 5 1 67 2019 2 40 3 12 4 8 1 128 2020 2 95 3 37 4 20 1 149 2021 2 133 3 78 4 55 Calculate the first centered moving average for this time series data. A. 27.25 B. 29.375 С. 31.5 D. 32


Q: I am taking in at my optimal bundle, and suddenly I get free goods of
A: Definitely it is beneficial for you because Tracking down exceptional and intriguing contraptions or…
Q: What are the drawbacks of using a Data Model in a project?
A: You are working on an important project and you have realized that you should use a data model for…
Q: The ALBA Company produces a range of personal and laptop computers. Following is the MRP plan, Lot…
A: MRP plan helps to determine when to procure and how much. It considers lead time, safety stock,…
Q: How can a budget deficit be reduced? By only increasing taxes Lowering taxes and raising government…
A: A budget deficit refers to a condition where the government expenditure is in excess over its…
Q: A certain reagent is created to test for an infectious disease. The test has an accuracy rate of p =…
A: Given : Accuracy rate of p = 90%, People are infected q = 5%
Q: Social Security payments are a form of _ and available to - Automatic stabilizers; current retirees…
A: Social security payments refers to the contributions made by the individual in order to get secured…
Q: What was one national security policy the United States established during the Covid-19 pandemic?
A: Covid-19 pandemic has resulted in huge loss to human life. It presented an extraordinary challenge…
Q: Data-flow diagrams may be utilized in business process reengineering, but how do they work?
A: Data flow diagram describes the flow of information in a system or process. It graphically…
Q: Increasing the turnover of finished goods inventory will increase the operating cycle Select one:…
A: Operating cycle refers to the average time that is required for a business to spend the cash…
Q: Green Valley Mills produces carpet at plants in (1)St. Louis, (2)Richmond, and (3)Nashville. The…
A: Given data is
Q: what is the 3 Planning At Different Levels In The Firm? what is the importance of the 3 Planning At…
A: Managers working at all stages, be it the higher-level administration or the lower-level…
Q: Simple moving average, Weighted moving average, Simple Exponential Smoothing, Regression. Choose two…
A: Forecasting is a technique used to predict future outcomes on the basis of past data. In businesses…
Q: Bell Computers purchases integrated chips at $350 per chip. The holding cost is $35 per unit per…
A:
Q: What do the following components of US expat compensation packages mean: Basic Compensation,…
A: The expat package can be stated as the amalgamation of basic salary along with the advantages…
Q: The following table details the tasks required for Indiana-based Frank Pianki Industries to…
A:
Q: n your opinion, why do you think data quality is so important in data warehousing? Do you know the…
A: Data quality means maintaining and improving the accuracy of data in data storehouse. Data Quality…
Q: A Pizza Company has a demand forecast for the next 12 months that is shown in Table 1 The current…
A: Find the Given details below: Month January February March April May June July August September…
Q: The use of milestones assists in the tracking of project progress. In many of the client…
A: A milestone is a pointer in a project that indicates a variation or stage in expansion. Milestones…
Q: Explain the advantages of using network diagrams rather than Gantt Charts.
A: A network diagram is a diagram that shows a pictorial representation of the project activities and…
Q: How do the concepts of capacity planning and scalability apply?
A: Capacity planning and scalability are important concepts in modern IT management, and knowing the…
Q: Describe a number of project assessment criteria in detail.
A: Project management is the management in which different types of skills, processes, and techniques…
Q: ou've seen in Performan
A: Performance Testing
Q: You work for a small shipping company and warehouse. The owners have decided to update the software…
A: Strategic management is the procedure of setting objectives, procedures, & objectives in command…
Q: A firm orders apparels from a distant country and can order only once for the entire season. This…
A: Given data Mean demand = 8500 units Standard deviation = 650 units Selling price = $25 Cost…
Q: Which of the following statements about just-in-time delivery is false? Multiple Choice Just-in-time…
A: Just in time is a busines strategy that would align the raw material orders from the vendors…
Q: Westside Auto purchases a component used in the manufacturing of automobile generators directly from…
A: EOQ Only when a product's demand remains consistent throughout the year and each new order is…
Q: There are three general approaches to anti-corruption training and education in MNC’s. List the…
A: Corruption can be stated as the abuse of power for private gain. It is one thing that not supposed…
Q: A cement manufacturing company will produce 24 tons per week. The demand for the cement is 6 tons…
A: Given data Annual demand (D) =6 tons per week ×52 weeks in a year =312 tonnes of units per year…
Q: Ivell Packaging Company produces paper and plastic packaging products. All of the following may be…
A: Corporate social responsibility often called CSR can be stated as the type of business…
Q: The table below shows the activities, their immediate predecessors and activity time estimates (in…
A: “Since you have posted a question with multiple sub-parts, we will solve first three sub-parts for…
Q: Use one or some example(s) to illustrate the difference between outsourcing, offshoring,…
A: Outsourcing and offshoring, two terms that get thrown around casually all the time, seem to be…
Q: revenue forecast apply to sensitivity analysis
A: ‘Sensitivity Analysis’ is an instrument utilized in financial modelling to analyse how the various…
Q: What exactly is benchmarking, and how does it work?
A: Benchmarking is a form of strategy in which the one firm copies the startegy and policy of another…
Q: To maintain a balanced budget during a recession, what should the government do? Decrease taxes,…
A: Recession is a period where the government has no control and is a situation where the income of…
Q: A fertilizer manufacturer has to fulfill supply contracts to its two main customers (650 tons to…
A: VA1 = tons shipped to customer A from warehouse 1VA2 = tons shipped to customer A from warehouse…
Q: What is benchmarking, and how does it vary from quality improvement?
A: Benchmarking is a process in which the firm tries to copies the strategies ,policies or best…
Q: Determine : 2a) the Tc in seconds
A: Production time is the total of the duration/time period that is used in the production of a…
Q: How have Graeter’s owners used the four factors of production to build the business over time?
A: Factors of production are some of the resources that are used commonly to manufacture a product or…
Q: Product design has been identified as the real key to world- competitive business. The steps in the…
A: Product design is the procedure when a novel product is formed to sell to customs. The phases of the…
Q: 6) When United States residents acquire assets abroad, they are in essence A) borrowing money, and…
A: Foreign trade refers to a trade which is a country either imports or exports and there is a use of…
Q: Sam's Cat Hotel operates 52 weeks per year, 5 days per week, and uses a continuous review inventory…
A:
Q: r in-process quality control. It is required to describe how Computer Aided Inspections (CAI) and…
A: Quality control (QC) is a technique used to maintain or enhance product quality. For quality…
Q: What three factors are considered while purchasing hardware?
A: Hardware refers to a tangible assets which we can see and feel it and has physical appearance.
Q: Generally, in order to receive the protection of a copyright it must be:
A: As there are multiple questions , I have answered the first one. IP is any product/ outcome of a…
Q: The owner of a machine shop is planning to expand by purchasing some new machines—presses and…
A: Objective Functions and Constraints: Based on the given details, the objective…
Q: What is the significance of aligning the capabilities of the process to the needs of the product?
A: Aligning by capability provides a cooperative organization. It enables working as an ecosystem to…
Q: Find initial solution using Least Method and identify special case
A: The transportation model is used to calculate the minimum cost of the route by selecting different…
Q: Subject: Product Design and Development Make sure your answer is right if not surely it will be…
A: Variable cost refers to the costs which varies with the change in the output ,an increase in output…
Q: A system must attain a reliability of not less than 0.90 for a 2 hour mission. The reliability is to…
A: given, reliability not less than =0.90 for 2 hrs confidence level =80%

Step by step
Solved in 2 steps with 2 images

- The management of a technology company is trying to determine the variable that best explains the variation of employee salaries using a sample of 52 full-time employees; see the file P13_08.xlsx. Estimate simple linear regression equations to identify which of the following has the strongest linear relationship with annual salary: the employees gender, age, number of years of relevant work experience prior to employment at the company, number of years of employment at the company, or number of years of post secondary education. Provide support for your conclusion.Suppose that a regional express delivery service company wants to estimate the cost of shipping a package (Y) as a function of cargo type, where cargo type includes the following possibilities: fragile, semifragile, and durable. Costs for 15 randomly chosen packages of approximately the same weight and same distance shipped, but of different cargo types, are provided in the file P13_16.xlsx. a. Estimate a regression equation using the given sample data, and interpret the estimated regression coefficients. b. According to the estimated regression equation, which cargo type is the most costly to ship? Which cargo type is the least costly to ship? c. How well does the estimated equation fit the given sample data? How might the fit be improved? d. Given the estimated regression equation, predict the cost of shipping a package with semifragile cargo.The Baker Company wants to develop a budget to predict how overhead costs vary with activity levels. Management is trying to decide whether direct labor hours (DLH) or units produced is the better measure of activity for the firm. Monthly data for the preceding 24 months appear in the file P13_40.xlsx. Use regression analysis to determine which measure, DLH or Units (or both), should be used for the budget. How would the regression equation be used to obtain the budget for the firms overhead costs?
- The file P13_29.xlsx contains monthly time series data for total U.S. retail sales of building materials (which includes retail sales of building materials, hardware and garden supply stores, and mobile home dealers). a. Is seasonality present in these data? If so, characterize the seasonality pattern. b. Use Winters method to forecast this series with smoothing constants = = 0.1 and = 0.3. Does the forecast series seem to track the seasonal pattern well? What are your forecasts for the next 12 months?Stock market analysts are continually looking for reliable predictors of stock prices. Consider the problem of modeling the price per share of electric utility stocks (Y). Two variables thought to influence this stock price are return on average equity (X1) and annual dividend rate (X2). The stock price, returns on equity, and dividend rates on a randomly selected day for 16 electric utility stocks are provided in the file P13_15.xlsx. Estimate a multiple regression equation using the given data. Interpret each of the estimated regression coefficients. Also, interpret the standard error of estimate and the R-square value for these data.A small computer chip manufacturer wants to forecast monthly ozperating costs as a function of the number of units produced during a month. The company has collected the 16 months of data in the file P13_34.xlsx. a. Determine an equation that can be used to predict monthly production costs from units produced. Are there any outliers? b. How could the regression line obtained in part a be used to determine whether the company was efficient or inefficient during any particular month?
- The file P13_28.xlsx contains monthly retail sales of U.S. liquor stores. a. Is seasonality present in these data? If so, characterize the seasonality pattern. b. Use Winters method to forecast this series with smoothing constants = = 0.1 and = 0.3. Does the forecast series seem to track the seasonal pattern well? What are your forecasts for the next 12 months?The file P13_26.xlsx contains the monthly number of airline tickets sold by the CareFree Travel Agency. a. Create a time series chart of the data. Based on what you see, which of the exponential smoothing models do you think will provide the best forecasting model? Why? b. Use simple exponential smoothing to forecast these data, using a smoothing constant of 0.1. c. Repeat part b, but search for the smoothing constant that makes RMSE as small as possible. Does it make much of an improvement over the model in part b?The file P13_25.xlsx contains the quarterly numbers of applications for home mortgage loans at a branch office of Northern Central Bank. a. Create a time series chart of the data. Based on what you see, which of the exponential smoothing models do you think will provide the best forecasting model? Why? b. Use simple exponential smoothing to forecast these data, using a smoothing constant of 0.1. c. Repeat part b, but search for the smoothing constant that makes RMSE as small as possible. Does it make much of an improvement over the model in part b? Is it guaranteed to produce better forecasts for the future?
- The owner of a restaurant in Bloomington, Indiana, has recorded sales data for the past 19 years. He has also recorded data on potentially relevant variables. The data are listed in the file P13_17.xlsx. a. Estimate a simple regression equation involving annual sales (the dependent variable) and the size of the population residing within 10 miles of the restaurant (the explanatory variable). Interpret R-square for this regression. b. Add another explanatory variableannual advertising expendituresto the regression equation in part a. Estimate and interpret this expanded equation. How does the R-square value for this multiple regression equation compare to that of the simple regression equation estimated in part a? Explain any difference between the two R-square values. How can you use the adjusted R-squares for a comparison of the two equations? c. Add one more explanatory variable to the multiple regression equation estimated in part b. In particular, estimate and interpret the coefficients of a multiple regression equation that includes the previous years advertising expenditure. How does the inclusion of this third explanatory variable affect the R-square, compared to the corresponding values for the equation of part b? Explain any changes in this value. What does the adjusted R-square for the new equation tell you?An automobile manufacturer is considering whether to introduce a new model called the Racer. The profitability of the Racer depends on the following factors: The fixed cost of developing the Racer is triangularly distributed with parameters 3, 4, and 5, all in billions. Year 1 sales are normally distributed with mean 200,000 and standard deviation 50,000. Year 2 sales are normally distributed with mean equal to actual year 1 sales and standard deviation 50,000. Year 3 sales are normally distributed with mean equal to actual year 2 sales and standard deviation 50,000. The selling price in year 1 is 25,000. The year 2 selling price will be 1.05[year 1 price + 50 (% diff1)] where % diff1 is the number of percentage points by which actual year 1 sales differ from expected year 1 sales. The 1.05 factor accounts for inflation. For example, if the year 1 sales figure is 180,000, which is 10 percentage points below the expected year 1 sales, then the year 2 price will be 1.05[25,000 + 50( 10)] = 25,725. Similarly, the year 3 price will be 1.05[year 2 price + 50(% diff2)] where % diff2 is the percentage by which actual year 2 sales differ from expected year 2 sales. The variable cost in year 1 is triangularly distributed with parameters 10,000, 12,000, and 15,000, and it is assumed to increase by 5% each year. Your goal is to estimate the NPV of the new car during its first three years. Assume that the company is able to produce exactly as many cars as it can sell. Also, assume that cash flows are discounted at 10%. Simulate 1000 trials to estimate the mean and standard deviation of the NPV for the first three years of sales. Also, determine an interval such that you are 95% certain that the NPV of the Racer during its first three years of operation will be within this interval.Freight car loadings over a 12-year period at a busy port are as follows:Week Number Week Number Week Number1 220 7 350 13 4602 245 8 360 14 4753 280 9 400 15 5004 275 10 380 16 5105 300 11 420 17 5256 310 12 450 18 541a. Determine a linear trend line for expected freight car loadings.b. Use the trend equation to predict expected loadings for weeks 20 and 21.c. The manager intends to install new equipment when the volume exceeds 800 loadings per week.Assuming the current trend continues, the loading volume will reach that level in approximatelywhat week?