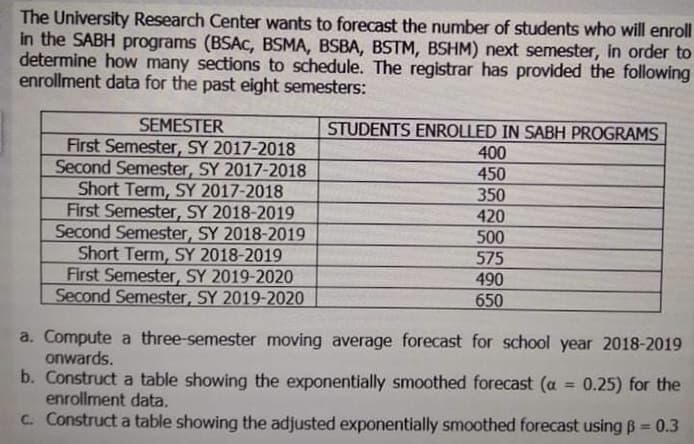
The University Research Center wants to forecast the number of students who will enroll in the SABH programs (BSAC, BSMA, BSBA, BSTM, BSHM) next semester, in order to determine how many sections to schedule. The registrar has provided the following enrollment data for the past eight semesters: SEMESTER First Semester, SY 2017-2018 Second Semester, SY 2017-2018 Short Term, SY 2017-2018 First Semester, SY 2018-2019 Second Semester, SY 2018-2019 Short Term, SY 2018-2019 First Semester, SY 2019-2020 Second Semester, SY 2019-2020 STUDENTS ENROLLED IN SABH PROGRAMS 400 450 350 420 500 575 490 650 a. Compute a three-semester moving average forecast for school year 2018-2019 onwards. b. Construct a table showing the exponentially smoothed forecast (a = 0.25) for the enrollment data. C. Construct a table showing the adjusted exponentially smoothed forecast using B = 0.3 %3D
The University Research Center wants to forecast the number of students who will enroll in the SABH programs (BSAC, BSMA, BSBA, BSTM, BSHM) next semester, in order to determine how many sections to schedule. The registrar has provided the following enrollment data for the past eight semesters: SEMESTER First Semester, SY 2017-2018 Second Semester, SY 2017-2018 Short Term, SY 2017-2018 First Semester, SY 2018-2019 Second Semester, SY 2018-2019 Short Term, SY 2018-2019 First Semester, SY 2019-2020 Second Semester, SY 2019-2020 STUDENTS ENROLLED IN SABH PROGRAMS 400 450 350 420 500 575 490 650 a. Compute a three-semester moving average forecast for school year 2018-2019 onwards. b. Construct a table showing the exponentially smoothed forecast (a = 0.25) for the enrollment data. C. Construct a table showing the adjusted exponentially smoothed forecast using B = 0.3 %3D

Practical Management Science
6th Edition
ISBN:9781337406659
Author:WINSTON, Wayne L.
Publisher:WINSTON, Wayne L.
Chapter11: Simulation Models
Section: Chapter Questions
Problem 69P: The Tinkan Company produces one-pound cans for the Canadian salmon industry. Each year the salmon...

Related questions

Question
Transcribed Image Text:The University Research Center wants to forecast the number of students who will enroll
in the SABH programs (BSAC, BSMA, BSBA, BSTM, BSHM) next semester, in order to
determine how many sections to schedule. The registrar has provided the following
enrollment data for the past eight semesters:
SEMESTER
First Semester, SY 2017-2018
Second Semester, SY 2017-2018
Short Term, SY 2017-2018
First Semester, SY 2018-2019
Second Semester, SY 2018-2019
Short Term, SY 2018-2019
First Semester, SY 2019-2020
Second Semester, SY 2019-2020
STUDENTS ENROLLED IN SABH PROGRAMS
400
450
350
420
500
575
490
650
a. Compute a three-semester moving average forecast for school year 2018-2019
onwards.
b. Construct a table showing the exponentially smoothed forecast (a = 0.25) for the
enrollment data.
C. Construct a table showing the adjusted exponentially smoothed forecast using B 0.3
%3D
Expert Solution
This question has been solved!
Explore an expertly crafted, step-by-step solution for a thorough understanding of key concepts.

This is a popular solution!

Trending now
This is a popular solution!

Step by step
Solved in 2 steps with 2 images

Knowledge Booster


Learn more about
Need a deep-dive on the concept behind this application? Look no further. Learn more about this topic, operations-management and related others by exploring similar questions and additional content below.Recommended textbooks for you
Practical Management Science
Operations Management
ISBN:
9781337406659
Author:
WINSTON, Wayne L.
Publisher:
Cengage,
Practical Management Science
Operations Management
ISBN:
9781337406659
Author:
WINSTON, Wayne L.
Publisher:
Cengage,