The UV Index is a standardized scale that forecasts the intensity of UV radiation at any given time and location in the globe; the higher the number, the greater the intensity. Examine Figure 1 on the next page and answer Questions 1-4. 1. Interpret the data in the graph below. Describe the relationship between the UV Index (the colored bar in Figure 1) and latitude (y-axis). (Cii) 2. How do you explain the relationship between the UV Index and latitude? (In other words, why does UV intensity change with latitude?) (Cii) Figure 1. Ultraviolet Radiation Index Across the World. Erythemal UV index Clear-sky 24 September 2015 KNMI/ESA The colors on this map of the world represent Ultraviolet (UV) Index values on a particular day in September 2015. The UV Index is a standardized scale of UV radiation intensity running from 0 (least intense) to 18 (most intense). The y-axis values are degrees of latitude, which range from the equator (0") to the poles (90* north and -90° south). The x-axis values are degrees of longitude, which range from the prime
The UV Index is a standardized scale that forecasts the intensity of UV radiation at any given time and location in the globe; the higher the number, the greater the intensity. Examine Figure 1 on the next page and answer Questions 1-4. 1. Interpret the data in the graph below. Describe the relationship between the UV Index (the colored bar in Figure 1) and latitude (y-axis). (Cii) 2. How do you explain the relationship between the UV Index and latitude? (In other words, why does UV intensity change with latitude?) (Cii) Figure 1. Ultraviolet Radiation Index Across the World. Erythemal UV index Clear-sky 24 September 2015 KNMI/ESA The colors on this map of the world represent Ultraviolet (UV) Index values on a particular day in September 2015. The UV Index is a standardized scale of UV radiation intensity running from 0 (least intense) to 18 (most intense). The y-axis values are degrees of latitude, which range from the equator (0") to the poles (90* north and -90° south). The x-axis values are degrees of longitude, which range from the prime

Chapter3: Suffixes
Section: Chapter Questions
Problem A6CRE

Related questions
Question
Transcribed Image Text:Unit 3 Summative
Jade Madrigal - Unit 3 X
Classwork for IB MYP C X
Jade Madrigal - Unit 3 X
Meet - uuq-jpnd-
(8) Louder than bombs X
My Questions | bartleb X
+
A docs.google.com/document/d/1WYZN-x1e1djYuiLJ8k2WmV3Hr0EThG775-qSEqzZJOI/edit
Jade Madrigal - Unit 3 Summative
☆ 回
TURN IN
Share
File
Edit View Insert
Format Tools Add-ons Help
Last edit was 11 minutes ago
- - 12 + BI U A
E E E E
Aア
100%
Normal text
Arial
E E
Editing
▼
▼
1
2
3 I I I
4
6.
7
I 8
PART 1: Is There a Connection Between UV Radiation and Skin Color?
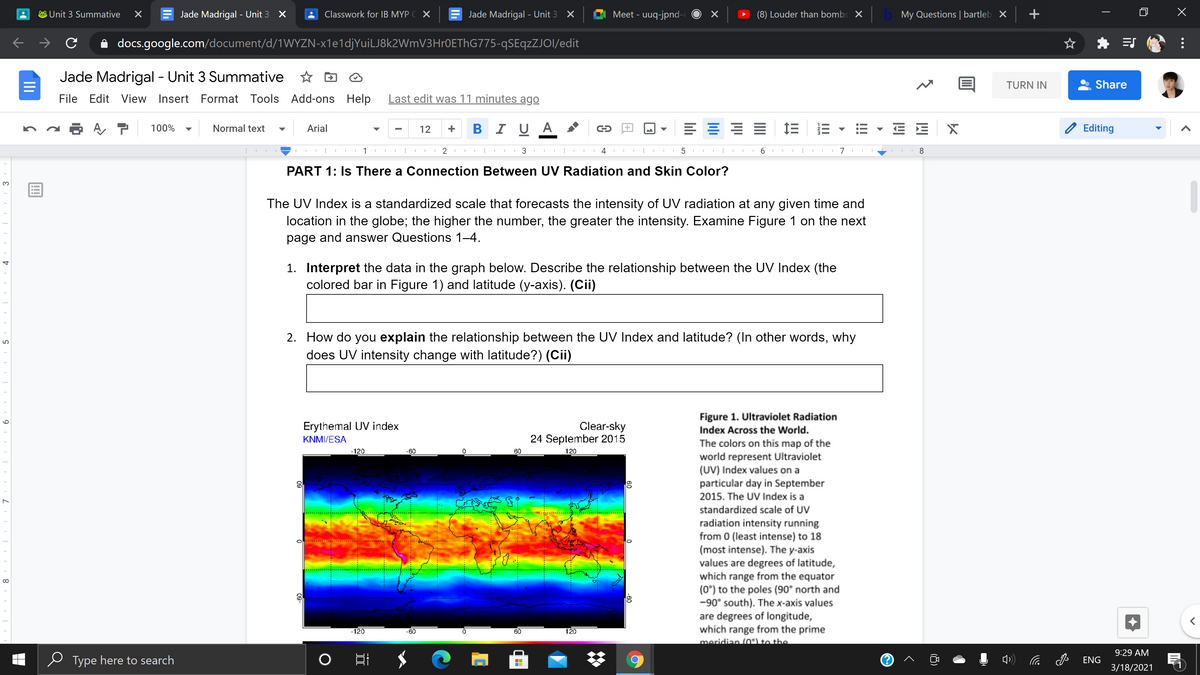
The UV Index is a standardized scale that forecasts the intensity of UV radiation at any given time and
location in the globe; the higher the number, the greater the intensity. Examine Figure 1 on the next
page and answer Questions 1–4.
1. Interpret the data in the graph below. Describe the relationship between the UV Index (the
colored bar in Figure 1) and latitude (y-axis). (Cii)
2. How do you explain the relationship between the UV Index and latitude? (In other words, why
does UV intensity change with latitude?) (Cii)
LO
Figure 1. Ultraviolet Radiation
Clear-sky
24 September 2015
Erythemal UV index
Index Across the World.
KNMI/ESA
The colors on this map of the
world represent Ultraviolet
(UV) Index values on a
particular day in September
-120
-60
60
120
2015. The UV Index is a
standardized scale of UV
radiation intensity running
from 0 (least intense) to 18
(most intense). The y-axis
values are degrees of latitude,
which range from the equator
(0*) to the poles (90° north and
-90° south). The x-axis values
are degrees of longitude,
which range from the prime
meridian (o) to the
........
-120
-60
60
120
9:29 AM
Type here to search
口
P ENG
3/18/2021
(8)
!!
II
II
09
09
Ili
4.
9.
5
Expert Solution
This question has been solved!
Explore an expertly crafted, step-by-step solution for a thorough understanding of key concepts.

This is a popular solution!

Trending now
This is a popular solution!

Step by step
Solved in 2 steps

Recommended textbooks for you

Biology: The Unity and Diversity of Life (MindTap…
Biology
ISBN:
9781305073951
Author:
Cecie Starr, Ralph Taggart, Christine Evers, Lisa Starr
Publisher:
Cengage Learning
Medical Terminology for Health Professions, Spira…
Health & Nutrition
ISBN:
9781305634350
Author:
Ann Ehrlich, Carol L. Schroeder, Laura Ehrlich, Katrina A. Schroeder
Publisher:
Cengage Learning

Comprehensive Medical Assisting: Administrative a…
Nursing
ISBN:
9781305964792
Author:
Wilburta Q. Lindh, Carol D. Tamparo, Barbara M. Dahl, Julie Morris, Cindy Correa
Publisher:
Cengage Learning