The value for μ is 1,025. It is not 1,064

Linear Algebra: A Modern Introduction
4th Edition
ISBN:9781285463247
Author:David Poole
Publisher:David Poole
Chapter4: Eigenvalues And Eigenvectors
Section4.6: Applications And The Perron-frobenius Theorem
Problem 25EQ

Related questions
Question
The value for μ is 1,025. It is not 1,064
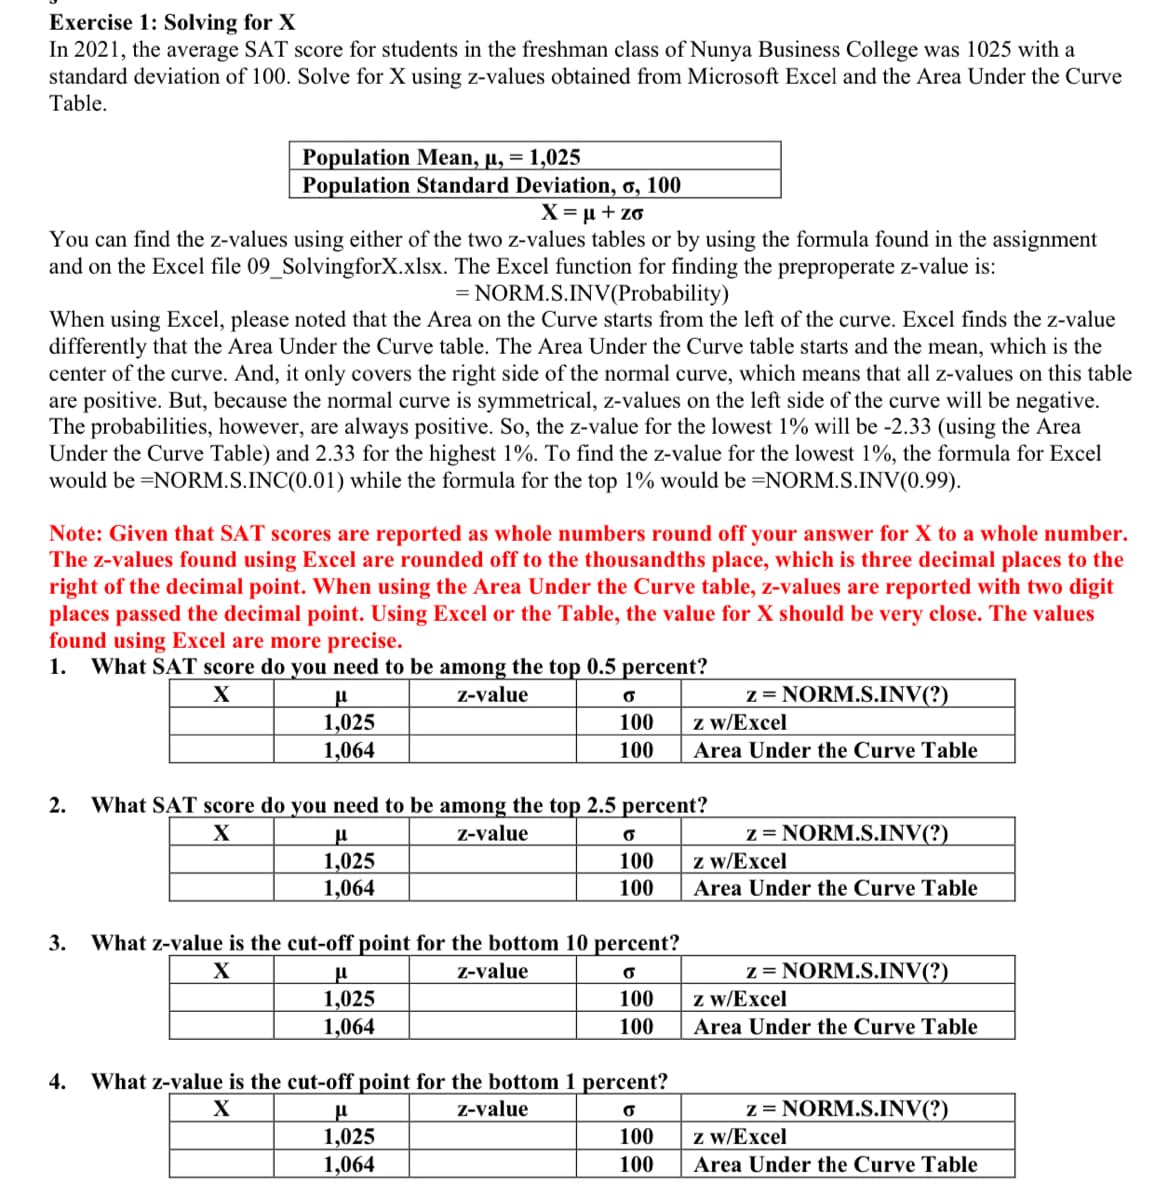
Transcribed Image Text:Exercise 1: Solving for X
In 2021, the average SAT score for students in the freshman class of Nunya Business College was 1025 with a
standard deviation of 100. Solve for X using z-values obtained from Microsoft Excel and the Area Under the Curve
Table.
Population Mean, µ, = 1,025
Population Standard Deviation, o, 100
X = µ + zo
You can find the z-values using either of the two z-values tables or by using the formula found in the assignment
and on the Excel file 09_SolvingforX.xlsx. The Excel function for finding the preproperate z-value is:
= NORM.S.INV(Probability)
When using Excel, please noted that the Area on the Curve starts from the left of the curve. Excel finds the z-value
differently that the Area Under the Curve table. The Area Under the Curve table starts and the mean, which is the
center of the curve. And, it only covers the right side of the normal curve, which means that all z-values on this table
are positive. But, because the normal curve is symmetrical, z-values on the left side of the curve will be negative.
The probabilities, however, are always positive. So, the z-value for the lowest 1% will be -2.33 (using the Area
Under the Curve Table) and 2.33 for the highest 1%. To find the z-value for the lowest 1%, the formula for Excel
would be =NORM.S.INC(0.01) while the formula for the top 1% would be =NORM.S.INV(0.99).
Note: Given that SAT scores are reported as whole numbers round off your answer for X to a whole number.
The z-values found using Excel are rounded off to the thousandths place, which is three decimal places to the
right of the decimal point. When using the Area Under the Curve table, z-values are reported with two digit
places passed the decimal point. Using Excel or the Table, the value for X should be very close. The values
found using Excel are more precise.
What SAT score do you need to be among the top 0.5 percent?
1.
z = NORM.S.INV(?)
z w/Excel
Z-value
1,025
1,064
100
100
Area Under the Curve Table
2.
What SAT score do you need to be among the top 2.5 percent?
z = NORM.S.INV(?)
z w/Excel
Z-value
1,025
1,064
100
100
Area Under the Curve Table
3.
What z-value is the cut-off point for the bottom 10 percent?
z = NORM.S.INV(?)
z w/Excel
X
Z-value
1,025
1,064
100
100
Area Under the Curve Table
4.
What z-value is the cut-off point for the bottom 1 percent?
z = NORM.S.INV(?)
z w/Excel
Z-value
1,025
100
1,064
100
Area Under the Curve Table
Expert Solution
This question has been solved!
Explore an expertly crafted, step-by-step solution for a thorough understanding of key concepts.

This is a popular solution!

Trending now
This is a popular solution!

Step by step
Solved in 4 steps with 6 images

Recommended textbooks for you
Linear Algebra: A Modern Introduction
Algebra
ISBN:
9781285463247
Author:
David Poole
Publisher:
Cengage Learning

Algebra & Trigonometry with Analytic Geometry
Algebra
ISBN:
9781133382119
Author:
Swokowski
Publisher:
Cengage
Linear Algebra: A Modern Introduction
Algebra
ISBN:
9781285463247
Author:
David Poole
Publisher:
Cengage Learning
Algebra & Trigonometry with Analytic Geometry
Algebra
ISBN:
9781133382119
Author:
Swokowski
Publisher:
Cengage