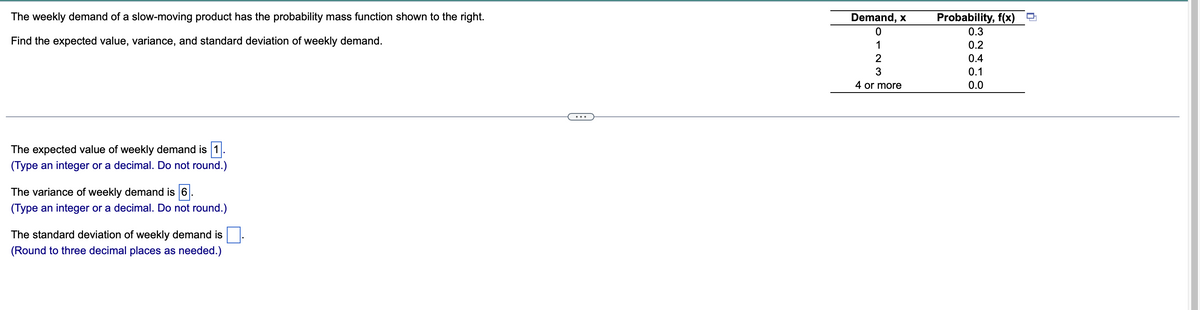
The weekly demand of a slow-moving product has the probability mass function shown to the right. Find the expected value, variance, and standard deviation of weekly demand. The expected value of weekly demand is 1. (Type an integer or a decimal. Do not round.) The variance of weekly demand is 6. (Type an integer or a decimal. Do not round.) The standard deviation of weekly demand is (Round to three decimal places as needed.) Demand, x 0 1 2 3 4 or more Probability, 0.3 0.2 0.4 0.1 0.0


Q: From several years’ records, a fish market manager has determined that the weight of deep sea bream…
A: The z-score is used to measure the statistical significance of a data point. The z-score is…
Q: Help Lizzy decide which of her friends should rent which equipment, and how much it will cost. Lizzy…
A: An assignment problem is a technique to find the combinations of the optimal solution to the…
Q: The master production schedule (MPS) specifies: Select one: None of the mentioned When the finished…
A: Master production schedule often called MPS can be stated as the term that is used to describe the…
Q: The information security plan of an organisation serves as a project strategy, but how is this…
A: Organizations use an information security plan to secure company details and information from being…
Q: The supply chain management opportunity called postponement involves delaying deliveries to prevent…
A: Inventory management is described as the process of managing or handling inventory. It acts to…
Q: How to improve the pharmacy supply chain management in operating room
A: In a hospice, the OR is one of the most expensive units to run. An investigation suggests that…
Q: What are the Importance of quality to the national interest of any country?
A: The term quality can be understood as fulfillment of certain prescribed standards. A quality product…
Q: a. How many decision variables will the linear programming model include? Number of decision…
A: Linear programming is a mathematical technique that is also used in operations management…
Q: Consider the following short case as you respond to the question: Abruzzi's Italian Kitchen is a…
A: Seperation of duties are significant no matter the scale of business. Seperation of duty helps to…
Q: Access Accor's current distribution strategy. What is the value of the OTA relationship to the…
A: A distribution strategy is an approach to making accessible of a product or a service to its…
Q: In the demand forecast, which of the following cannot be predicted? Select one: a. seasonal…
A: Demand forecasting is the process of predicting or estimating the future demand based on historical…
Q: CASE 3. Burger Doodle The manager of a Burger Doodle franchise wants to determine how many sausage…
A: Given data is Biscuit Labor(hr) Sausage(lb) Ham(lb) Flour(lb) Sausage 0.010 0.10 - 0.04 Ham…
Q: The difference between a group and a team is that: Select one: a. in a team each member has a job,…
A: The difference between a group and a team is that: Select one: a. in a team each member has a job,…
Q: According to MM Model, total value of firm is Decreases with the decreases in WACC Constant None of…
A: According to this approach the total cost of capital of a particular firm is independent of its…
Q: The manager of a Burger Doodle franchise wants to determine how many sausage biscuits and ham…
A: Objective Functions and Constraints: Based on the given details, the objective…
Q: North South Bank employs several account officers, each working eight hours per day. The bank…
A: Working hours 8 per day No. of applications 30 per day Labor productivity 1.25 applications per…
Q: CASE 3. Burger Doodle The manager of a Burger Doodle franchise wants to determine how many sausage…
A: Given data is Biscuit type Labor hours Sausage(lb) Ham(lb) Flour(lb) Sausage 0.010 0.10 0.04…
Q: CASE 3. Burger Doodle The manager of a Burger Doodle franchise wants to determine how many sausage…
A: Given data is Biscuit Labor(hr) Sausage(lb) Ham(lb) Flour(lb) Sausage 0.010 0.10 - 0.04 Ham…
Q: How does teamwork affect work performance and the possibility to win a game?
A: Teamwork can be stated as essential to the growth and success of the organization. Each living…
Q: The order-up-to model is used to manage inventory. The order-up-to model is 50, the lead time is 5…
A: Order Up To Model is a concept that was developed by the founder of The Marketing Zen Group, Jay…
Q: how are project management and software development different?
A: Difference in Software Development Project Management and Project Management I firmly…
Q: CASE 2. "The Possibility"Restaurant Angela Fox and Zooey Caulfield were food and nutrition majors at…
A: Objective Functions and Constraints: Based on the given details, the objective…
Q: A manufacturer of plastics is planning to blend a new product from for ical compounds. These…
A: Lets A1 , A2 , A3 , A4 be the amount of each compound in each the product . min B =…
Q: Location decision is a trade -off decision - why ??
A: Introduction Location decision is considered as an important decision it contributes to…
Q: Formulate the following problems as balanced assignment models: Person A is planning to organize a…
A:
Q: You have solved a 3-variable maximisation Linear Program with the objective function of z = 4x1 +…
A: Objective function: Maximize Z = 4x1+3x2+7x3 x1 = 7 x2 = 0 x3 = 0 Optimal value of Z =…
Q: The number of salespeople assigned to work during a shift is apportioned based on the average number…
A:
Q: Is distribution a cost or a benefit? Using one example of your choice, briefly explain how a…
A: Product distribution is the last process of a supply chain and also an integral process. Companies…
Q: Define Speculative production.
A: Production is the process in which inputs are combined to have the required output. It includes a…
Q: As technology evolves, consumers will see a growing number of vending machines for products,…
A: A vending machine can be stated as a technical or automated machine that offers or provides products…
Q: The quality management plan is a component of the organization's quality policies will be implemer…
A: The motive behind the Quality Management Plan is to affirm that a quality item is conveyed that…
Q: Electronics, Inc., in Nashv ces sn runs of custom ain ve scanners for the defense industry. You have…
A: In a manufacturing process, a kanban system is a form of inventory control that uses cards or tags…
Q: GENERATE GENERATE THE DECISION VARIABLE SOLUTION AND A SENSITIVITY REPORT 2. During the winter…
A: Let, R = Number of residential jobs C = Number of commercial jobs Objective function: Maximize Z =…
Q: CASE 3. Burger Doodle The manager of a Burger Doodle franchise wants to determine how many sausage…
A: The manager wants to find out the numbers of biscuits of each type to be prepared. Hence, let the…
Q: The Warren W. Fisher Computer Corporation purchases 8,000 transistors each year as components in…
A: Given Data Annual demand (D) = 8000 transistors or units Ordering cost (S) = $30 per order Cost of…
Q: What is Keynesian Economics and why is it important?
A: Keynesian economics is a macroeconomic economic theory that describes overall economic expenditure…
Q: Briefly explanation of question. Way How to improve the pharmacy supply chain management in…
A: Supply chain management:- The supply chain management definition is complex, but it boils down to…
Q: explain the various methods of Description used in procurement of goods?
A: The actual names of these could vary depending on your company and industry, but the process remains…
Q: Using the provided template, show the steps to get the solution. During each four-hour period, the…
A: Find the given details below: Given details: Starting 4 hours of 8-hour shift Midnight -…
Q: XYZ Steel Company manufactures two kinds of wrought-iron rails: Model E, the elegant, and Model D,…
A: Given data is Cost Selling price Profit Model D $90 $99 99-90=$9 Model E $81 $88 88-81=$7…
Q: I will give an upvote if you follow my instructions. thank you. please skip if you have already done…
A: The question is related Classification of Cost. It means the grouping of costs according to their…
Q: 1. When is the best time to do the cycle count? and give examples of cycle count methodologies.
A: The cycle count method provides the correct amount of stock available in the warehouse. This method…
Q: Excel QM B 2. A corporation plans on building a maximum of 11 new stores in a large city. They will…
A: Given data is Store size Cost Employees required Net revenue Convenience store $4.125 million…
Q: INSTRUCTIONS: 1. Read and understand the cases/problems properly. 2. Create an excel solution for…
A: Let, B = Units of basketball to be produced F = Units of Football to be produced Objective…
Q: GENERATE THE DECISION VARIABLE SOLUTION AND GENERATE A SENSITIVITY REPORT 1. Southern Sporting Goods…
A: Let, B = Units of basketball to be produced F = Units of Football to be produced Objective…
Q: Required: a. Solve the model formulated for Southern Sporting Goods Company using the computer. b.…
A: Linear programming is a mathematical technique that is also used in operations management…
Q: 5 labor nours na 5 boxes. And the last one needs 2 of raw material and 10 of labor hours and 3…
A: Linear programming is a mathematical technique used in the fields of optimization, operations…
Q: Does Reed Hastings demonstrate positional or personal power?
A: Reed Hastings also demonstrates respectable leadership power in both personal and position power.…
Q: Product M is made of 2 units of N and 3 unit of P. N is made of 2 units of R and 4 units of S. R is…
A: BOM or Bills of material or Product structure tree lists the components and sub-components and their…
Q: If the coefficient for Activity 2 in the objective function changes to $400, then the objective…
A: The allowable increase of activity 2 is 500. This means that the objective coefficient of activity 2…


Trending now
This is a popular solution!

Step by step
Solved in 2 steps

- A new edition of a very popular textbook will be published a year from now. The publisher currently has 1000 copies on hand and is deciding whether to do another printing before the new edition comes out. The publisher estimates that demand for the book during the next year is governed by the probability distribution in the file P10_31.xlsx. A production run incurs a fixed cost of 15,000 plus a variable cost of 20 per book printed. Books are sold for 190 per book. Any demand that cannot be met incurs a penalty cost of 30 per book, due to loss of goodwill. Up to 1000 of any leftover books can be sold to Barnes and Noble for 45 per book. The publisher is interested in maximizing expected profit. The following print-run sizes are under consideration: 0 (no production run) to 16,000 in increments of 2000. What decision would you recommend? Use simulation with 1000 replications. For your optimal decision, the publisher can be 90% certain that the actual profit associated with remaining sales of the current edition will be between what two values?It costs a pharmaceutical company 75,000 to produce a 1000-pound batch of a drug. The average yield from a batch is unknown but the best case is 90% yield (that is, 900 pounds of good drug will be produced), the most likely case is 85% yield, and the worst case is 70% yield. The annual demand for the drug is unknown, with the best case being 20,000 pounds, the most likely case 17,500 pounds, and the worst case 10,000 pounds. The drug sells for 125 per pound and leftover amounts of the drug can be sold for 30 per pound. To maximize annual expected profit, how many batches of the drug should the company produce? You can assume that it will produce the batches only once, before demand for the drug is known.Play Things is developing a new Lady Gaga doll. The company has made the following assumptions: The doll will sell for a random number of years from 1 to 10. Each of these 10 possibilities is equally likely. At the beginning of year 1, the potential market for the doll is two million. The potential market grows by an average of 4% per year. The company is 95% sure that the growth in the potential market during any year will be between 2.5% and 5.5%. It uses a normal distribution to model this. The company believes its share of the potential market during year 1 will be at worst 30%, most likely 50%, and at best 60%. It uses a triangular distribution to model this. The variable cost of producing a doll during year 1 has a triangular distribution with parameters 15, 17, and 20. The current selling price is 45. Each year, the variable cost of producing the doll will increase by an amount that is triangularly distributed with parameters 2.5%, 3%, and 3.5%. You can assume that once this change is generated, it will be the same for each year. You can also assume that the company will change its selling price by the same percentage each year. The fixed cost of developing the doll (which is incurred right away, at time 0) has a triangular distribution with parameters 5 million, 7.5 million, and 12 million. Right now there is one competitor in the market. During each year that begins with four or fewer competitors, there is a 25% chance that a new competitor will enter the market. Year t sales (for t 1) are determined as follows. Suppose that at the end of year t 1, n competitors are present (including Play Things). Then during year t, a fraction 0.9 0.1n of the company's loyal customers (last year's purchasers) will buy a doll from Play Things this year, and a fraction 0.2 0.04n of customers currently in the market ho did not purchase a doll last year will purchase a doll from Play Things this year. Adding these two provides the mean sales for this year. Then the actual sales this year is normally distributed with this mean and standard deviation equal to 7.5% of the mean. a. Use @RISK to estimate the expected NPV of this project. b. Use the percentiles in @ RISKs output to find an interval such that you are 95% certain that the companys actual NPV will be within this interval.
- W. L. Brown, a direct marketer of womens clothing, must determine how many telephone operators to schedule during each part of the day. W. L. Brown estimates that the number of phone calls received each hour of a typical eight-hour shift can be described by the probability distribution in the file P10_33.xlsx. Each operator can handle 15 calls per hour and costs the company 20 per hour. Each phone call that is not handled is assumed to cost the company 6 in lost profit. Considering the options of employing 6, 8, 10, 12, 14, or 16 operators, use simulation to determine the number of operators that minimizes the expected hourly cost (labor costs plus lost profits).Six months before its annual convention, the American Medical Association must determine how many rooms to reserve. At this time, the AMA can reserve rooms at a cost of 150 per room. The AMA believes the number of doctors attending the convention will be normally distributed with a mean of 5000 and a standard deviation of 1000. If the number of people attending the convention exceeds the number of rooms reserved, extra rooms must be reserved at a cost of 250 per room. a. Use simulation with @RISK to determine the number of rooms that should be reserved to minimize the expected cost to the AMA. Try possible values from 4100 to 4900 in increments of 100. b. Redo part a for the case where the number attending has a triangular distribution with minimum value 2000, maximum value 7000, and most likely value 5000. Does this change the substantive results from part a?A common decision is whether a company should buy equipment and produce a product in house or outsource production to another company. If sales volume is high enough, then by producing in house, the savings on unit costs will cover the fixed cost of the equipment. Suppose a company must make such a decision for a four-year time horizon, given the following data. Use simulation to estimate the probability that producing in house is better than outsourcing. If the company outsources production, it will have to purchase the product from the manufacturer for 25 per unit. This unit cost will remain constant for the next four years. The company will sell the product for 42 per unit. This price will remain constant for the next four years. If the company produces the product in house, it must buy a 500,000 machine that is depreciated on a straight-line basis over four years, and its cost of production will be 9 per unit. This unit cost will remain constant for the next four years. The demand in year 1 has a worst case of 10,000 units, a most likely case of 14,000 units, and a best case of 16,000 units. The average annual growth in demand for years 2-4 has a worst case of 7%, a most likely case of 15%, and a best case of 20%. Whatever this annual growth is, it will be the same in each of the years. The tax rate is 35%. Cash flows are discounted at 8% per year.
- Dilberts Department Store is trying to determine how many Hanson T-shirts to order. Currently the shirts are sold for 21, but at later dates the shirts will be offered at a 10% discount, then a 20% discount, then a 40% discount, then a 50% discount, and finally a 60% discount. Demand at the full price of 21 is believed to be normally distributed with mean 1800 and standard deviation 360. Demand at various discounts is assumed to be a multiple of full-price demand. These multiples, for discounts of 10%, 20%, 40%, 50%, and 60% are, respectively, 0.4, 0.7, 1.1, 2, and 50. For example, if full-price demand is 2500, then at a 10% discount customers would be willing to buy 1000 T-shirts. The unit cost of purchasing T-shirts depends on the number of T-shirts ordered, as shown in the file P10_36.xlsx. Use simulation to determine how many T-shirts the company should order. Model the problem so that the company first orders some quantity of T-shirts, then discounts deeper and deeper, as necessary, to sell all of the shirts.You now have 10,000, all of which is invested in a sports team. Each year there is a 60% chance that the value of the team will increase by 60% and a 40% chance that the value of the team will decrease by 60%. Estimate the mean and median value of your investment after 50 years. Explain the large difference between the estimated mean and median.Assume a very good NBA team has a 70% chance of winning in each game it plays. During an 82-game season what is the average length of the teams longest winning streak? What is the probability that the team has a winning streak of at least 16 games? Use simulation to answer these questions, where each iteration of the simulation generates the outcomes of all 82 games.
- Based on Marcus (1990). The Balboa mutual fund has beaten the Standard and Poors 500 during 11 of the last 13 years. People use this as an argument that you can beat the market. Here is another way to look at it that shows that Balboas beating the market 11 out of 13 times is not unusual. Consider 50 mutual funds, each of which has a 50% chance of beating the market during a given year. Use simulation to estimate the probability that over a 13-year period the best of the 50 mutual funds will beat the market for at least 11 out of 13 years. This probability turns out to exceed 40%, which means that the best mutual fund beating the market 11 out of 13 years is not an unusual occurrence after all.Assume that all of a companys job applicants must take a test, and that the scores on this test are normally distributed. The selection ratio is the cutoff point used by the company in its hiring process. For example, a selection ratio of 25% means that the company will accept applicants for jobs who rank in the top 25% of all applicants. If the company chooses a selection ratio of 25%, the average test score of those selected will be 1.27 standard deviations above average. Use simulation to verify this fact, proceeding as follows. a. Show that if the company wants to accept only the top 25% of all applicants, it should accept applicants whose test scores are at least 0.674 standard deviation above average. (No simulation is required here. Just use the appropriate Excel normal function.) b. Now generate 1000 test scores from a normal distribution with mean 0 and standard deviation 1. The average test score of those selected is the average of the scores that are at least 0.674. To determine this, use Excels DAVERAGE function. To do so, put the heading Score in cell A3, generate the 1000 test scores in the range A4:A1003, and name the range A3:A1003 Data. In cells C3 and C4, enter the labels Score and 0.674. (The range C3:C4 is called the criterion range.) Then calculate the average of all applicants who will be hired by entering the formula =DAVERAGE(Data, "Score", C3:C4) in any cell. This average should be close to the theoretical average, 1.27. This formula works as follows. Excel finds all observations in the Data range that satisfy the criterion described in the range C3:C4 (Score0.674). Then it averages the values in the Score column (the second argument of DAVERAGE) corresponding to these entries. See online help for more about Excels database D functions. c. What information would the company need to determine an optimal selection ratio? How could it determine the optimal selection ratio?Amanda has 30 years to save for her retirement. At the beginning of each year, she puts 5000 into her retirement account. At any point in time, all of Amandas retirement funds are tied up in the stock market. Suppose the annual return on stocks follows a normal distribution with mean 12% and standard deviation 25%. What is the probability that at the end of 30 years, Amanda will have reached her goal of having 1,000,000 for retirement? Assume that if Amanda reaches her goal before 30 years, she will stop investing. (Hint: Each year you should keep track of Amandas beginning cash positionfor year 1, this is 5000and Amandas ending cash position. Of course, Amandas ending cash position for a given year is a function of her beginning cash position and the return on stocks for that year. To estimate the probability that Amanda meets her goal, use an IF statement that returns 1 if she meets her goal and 0 otherwise.)