The weights (in grams) of several bags of chocolate chip cookies are given in the following table. Construct a histogram for the data using the groups 420 x < 430, 430≤x< 440, .... 480 x < 490. 451 479 467 475 frequency 8 6 420 435 482 449 454 451 448 432 423 461 475 453 448 459 454 444 466 461 450 446 458 3 440 460 480 weight in grams frequency 89 ● 6 420 440 460 480 weight in grams
The weights (in grams) of several bags of chocolate chip cookies are given in the following table. Construct a histogram for the data using the groups 420 x < 430, 430≤x< 440, .... 480 x < 490. 451 479 467 475 frequency 8 6 420 435 482 449 454 451 448 432 423 461 475 453 448 459 454 444 466 461 450 446 458 3 440 460 480 weight in grams frequency 89 ● 6 420 440 460 480 weight in grams

Glencoe Algebra 1, Student Edition, 9780079039897, 0079039898, 2018
18th Edition
ISBN:9780079039897
Author:Carter
Publisher:Carter
Chapter10: Statistics
Section10.6: Summarizing Categorical Data
Problem 4AGP

Related questions
Question
100%
Please refer to the pictures attached below.
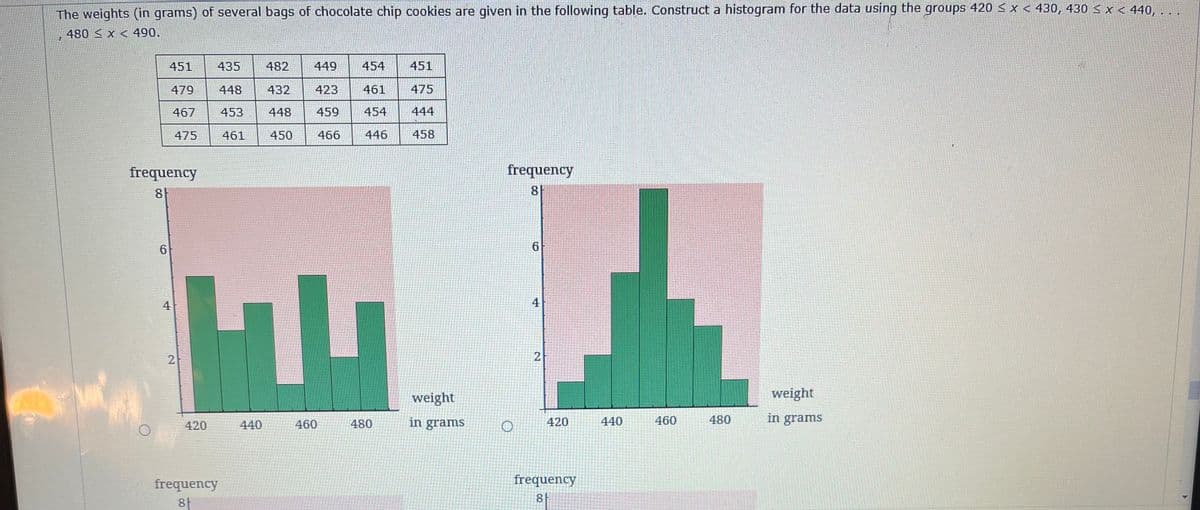
Transcribed Image Text:The weights (in grams) of several bags of chocolate chip cookies are given in the following table. Construct a histogram for the data using the groups 420 ≤ x < 430, 430 ≤ x < 440,...
480 x 490.
I
frequency
8
O
451
479
467
475
6
4
2
420
435
448
482
432
453 448 459 454
461 450
466
446
frequency
8f
449 454 451
423 461 475
440
460
480
458
weight
in grams
frequency
8
6
4
2
420
frequency
81
440
460
480
weight
in grams
Transcribed Image Text:O
420
frequency
6
440
460
460
480
480
WEIBIL
in grams
weight
in grams
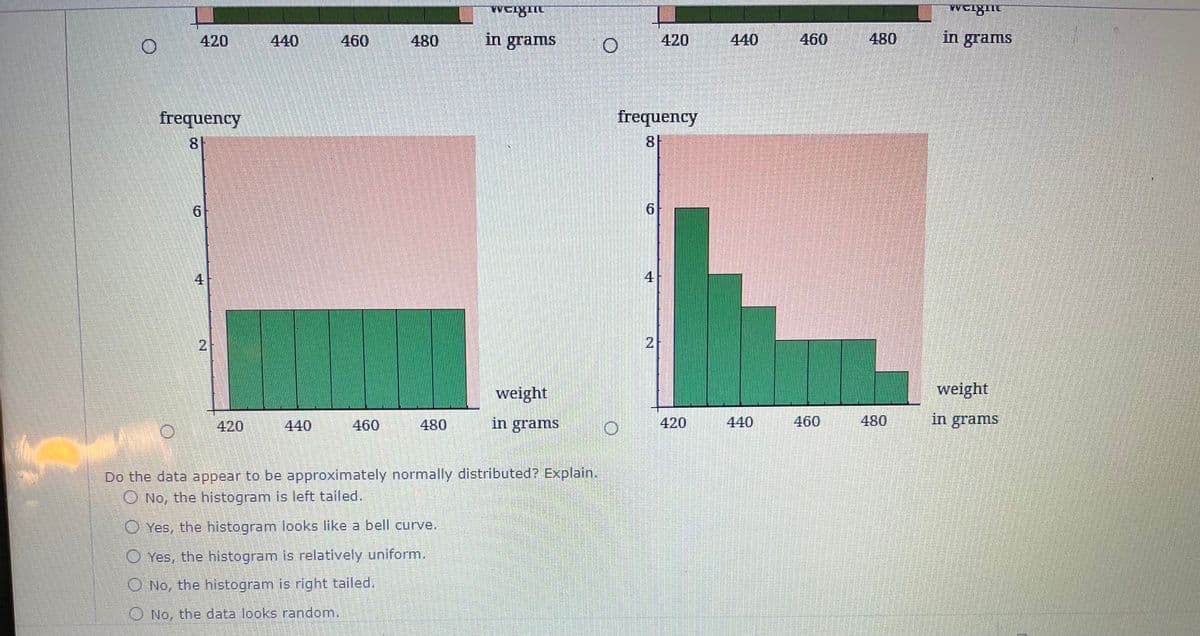
Do the data appear to be approximately normally distributed? Explain.
No, the histogram is left tailed.
Yes, the histogram looks like a bell curve.
Yes, the histogram is relatively uniform.
No, the histogram is right tailed.
No, the data looks random.
frequency
8
6
420
4
420
440
460
460
480
480
weight
in grams
weight
in grams
Expert Solution
This question has been solved!
Explore an expertly crafted, step-by-step solution for a thorough understanding of key concepts.

This is a popular solution!

Trending now
This is a popular solution!

Step by step
Solved in 3 steps with 1 images

Recommended textbooks for you
Glencoe Algebra 1, Student Edition, 9780079039897…
Algebra
ISBN:
9780079039897
Author:
Carter
Publisher:
McGraw Hill
Glencoe Algebra 1, Student Edition, 9780079039897…
Algebra
ISBN:
9780079039897
Author:
Carter
Publisher:
McGraw Hill