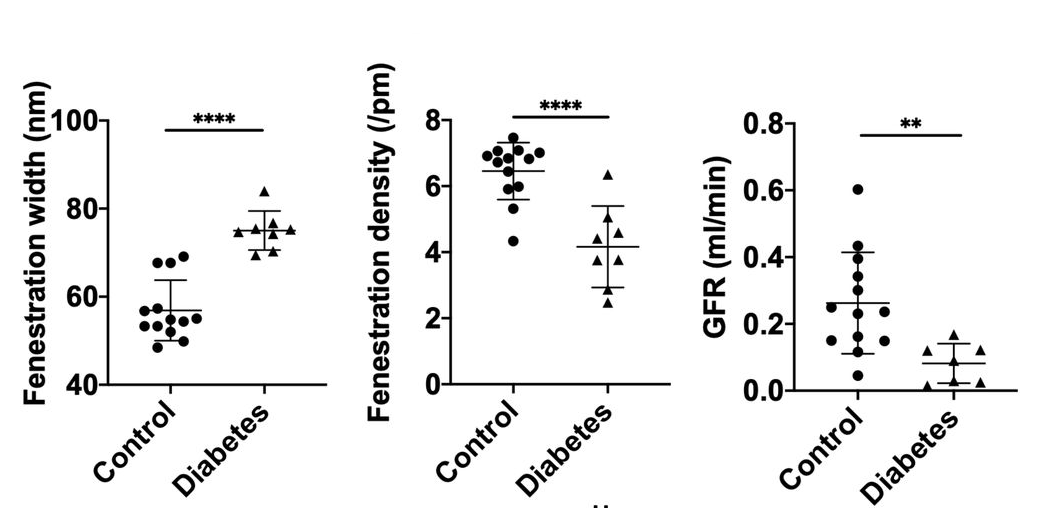
This graph shows what changes occuring during diabetic nephropathy? increase in fenestration width decrease in fenestration width increase in GFR decrease in GFR decrease in fenestration density
This graph shows what changes occuring during diabetic nephropathy? increase in fenestration width decrease in fenestration width increase in GFR decrease in GFR decrease in fenestration density

Chapter9: Parenteral Medication Labels And Dosage Calculation
Section: Chapter Questions
Problem 7.7P

Related questions

Question
Please help me with this question, more than one of the given answers may be correct:
This graph shows what changes occuring during diabetic nephropathy?
|
|
increase in fenestration width |
|
|
decrease in fenestration width |
|
|
increase in GFR |
|
|
decrease in GFR |
|
|
decrease in fenestration density |
Transcribed Image Text:Control
Diabetes
Diabetes
Fenestration width (nm)
Control
Diabetes
Fenestration density (/pm)
0.0-
Control
-08
21.
HH
…….
▶
GFR (ml/min)
|
|-
****
Expert Solution
This question has been solved!
Explore an expertly crafted, step-by-step solution for a thorough understanding of key concepts.

Step by step
Solved in 2 steps

Knowledge Booster


Learn more about
Need a deep-dive on the concept behind this application? Look no further. Learn more about this topic, biology and related others by exploring similar questions and additional content below.Recommended textbooks for you