THIS IS A MULTIPART QUESTION, PLEASE ANSWER ALL THANK YOU You are studying two bacterias, bacA and bacB. bacB has increased levels of peroxidase but no catalase. On the other hand, bacA has increased levels of catalase but no peroxidase. For the first experiment, you add both bacA and bacB in a buffer containing hydrogen peroxide and NO iron. After analyzing the amount of hydrogen peroxide after 1 hr in the buffer alone, then buffer with bacA, then buffer with bacB, the data below is shown. A. Oxygen levels are also being measured in each of the 3 conditions from the experiment above. Create a graph of the expected O2 level results, explain the rationale and label title with axis B. Graph the expected NAD+ level results in the 3 conditions present, explain rationale and label title with axis C. On the second experiment, everything was repeated like the first however, this time iron was added to the buffer. Create a graph of the expected oxygen levels after the addition to iron in all three environments. Note that there was no cell death and ROS detox. occurred all take place in the same rate, explain reasoning and label axis/title. D. What is the ROS name that is most likely absent in the buffers from parts A and B, but present in part C
THIS IS A MULTIPART QUESTION, PLEASE ANSWER ALL THANK YOU You are studying two bacterias, bacA and bacB. bacB has increased levels of peroxidase but no catalase. On the other hand, bacA has increased levels of catalase but no peroxidase. For the first experiment, you add both bacA and bacB in a buffer containing hydrogen peroxide and NO iron. After analyzing the amount of hydrogen peroxide after 1 hr in the buffer alone, then buffer with bacA, then buffer with bacB, the data below is shown. A. Oxygen levels are also being measured in each of the 3 conditions from the experiment above. Create a graph of the expected O2 level results, explain the rationale and label title with axis B. Graph the expected NAD+ level results in the 3 conditions present, explain rationale and label title with axis C. On the second experiment, everything was repeated like the first however, this time iron was added to the buffer. Create a graph of the expected oxygen levels after the addition to iron in all three environments. Note that there was no cell death and ROS detox. occurred all take place in the same rate, explain reasoning and label axis/title. D. What is the ROS name that is most likely absent in the buffers from parts A and B, but present in part C

Essentials of Pharmacology for Health Professions
7th Edition
ISBN:9781305441620
Author:WOODROW
Publisher:WOODROW
Chapter8: Administration By The Gastrointestinal Route
Section: Chapter Questions
Problem 11CRQ

Related questions
Question
THIS IS A MULTIPART QUESTION, PLEASE ANSWER ALL THANK YOU
You are studying two bacterias, bacA and bacB. bacB has increased levels of peroxidase but no catalase. On the other hand, bacA has increased levels of catalase but no peroxidase. For the first experiment, you add both bacA and bacB in a buffer containing hydrogen peroxide and NO iron. After analyzing the amount of hydrogen peroxide after 1 hr in the buffer alone, then buffer with bacA, then buffer with bacB, the data below is shown.
A. Oxygen levels are also being measured in each of the 3 conditions from the experiment above. Create a graph of the expected O2 level results, explain the rationale and label title with axis
B. Graph the expected NAD+ level results in the 3 conditions present, explain rationale and label title with axis
C. On the second experiment, everything was repeated like the first however, this time iron was added to the buffer. Create a graph of the expected oxygen levels after the addition to iron in all three environments. Note that there was no cell death and ROS detox. occurred all take place in the same rate, explain reasoning and label axis/title.
D. What is the ROS name that is most likely absent in the buffers from parts A and B, but present in part C
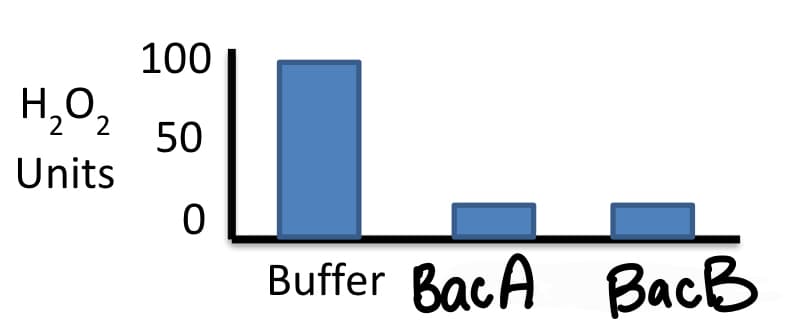
Transcribed Image Text:H₂O₂
2
Units
100
50
0
Buffer BacA BacB
Expert Solution
This question has been solved!
Explore an expertly crafted, step-by-step solution for a thorough understanding of key concepts.

Step by step
Solved in 4 steps with 1 images

Knowledge Booster


Learn more about
Need a deep-dive on the concept behind this application? Look no further. Learn more about this topic, biology and related others by exploring similar questions and additional content below.Recommended textbooks for you
Essentials of Pharmacology for Health Professions
Nursing
ISBN:
9781305441620
Author:
WOODROW
Publisher:
Cengage

Principles Of Radiographic Imaging: An Art And A …
Health & Nutrition
ISBN:
9781337711067
Author:
Richard R. Carlton, Arlene M. Adler, Vesna Balac
Publisher:
Cengage Learning
Essentials of Pharmacology for Health Professions
Nursing
ISBN:
9781305441620
Author:
WOODROW
Publisher:
Cengage
Principles Of Radiographic Imaging: An Art And A …
Health & Nutrition
ISBN:
9781337711067
Author:
Richard R. Carlton, Arlene M. Adler, Vesna Balac
Publisher:
Cengage Learning