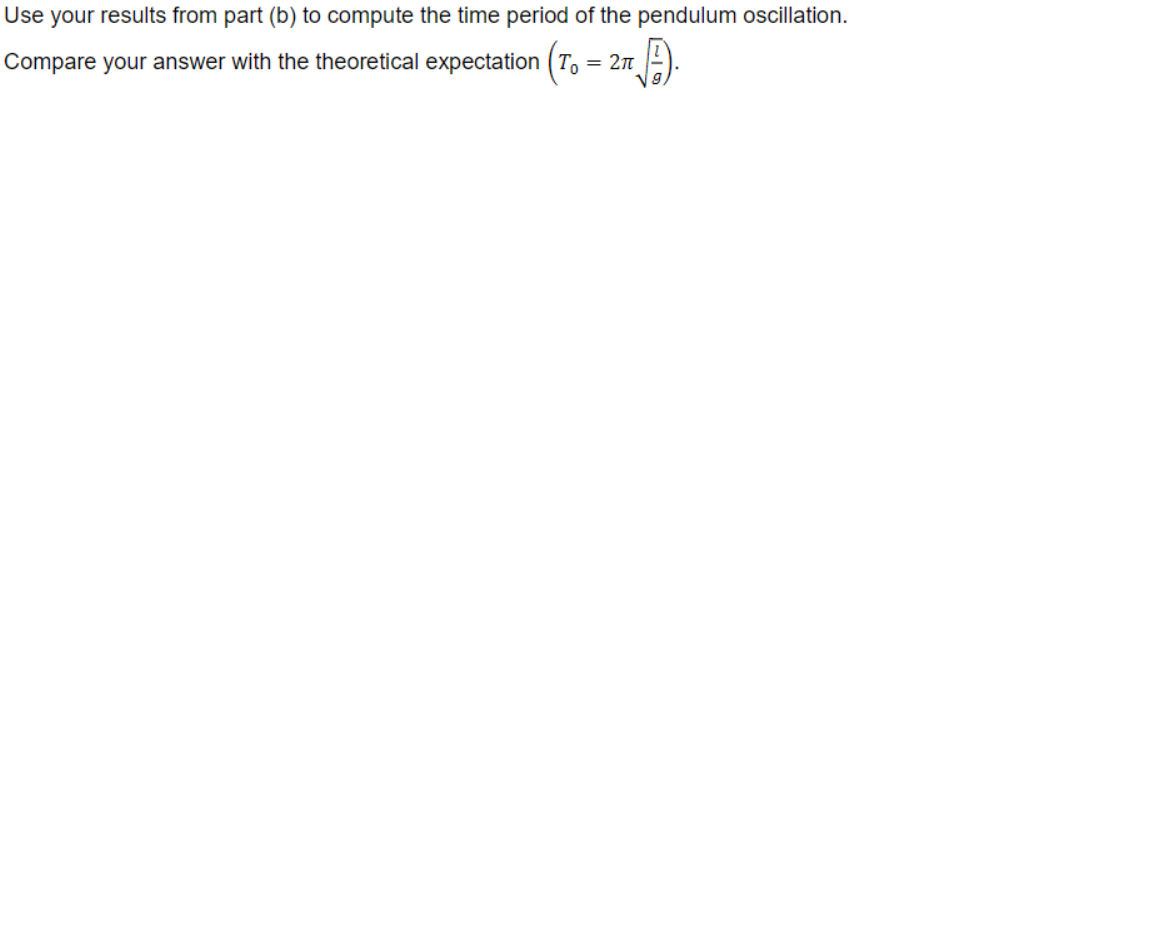
This is not a graded assignment but a part of a review I'm studying, please do not reject the question, and thank you in advance for your solution! My review problem is the attached image that isn't the graph! I have provided the info from the overall problem here: g is acceleration due to gravity, l is pendulum of length 10 cm and initial displacement theta of 10 degrees. and here is my code solution for part b) as well as the attached graph for b's solution necessary to answering my particular question: % Given parameters initial_displacement = 10; % in degrees pendulum_length = 0.1; % in meters (10 cm) gravity = 9.81; % acceleration due to gravity in m/s^2 time_points = 100; time_axis = linspace(0, 1, time_points); % Time axis from 0 to 1 seconds % Convert initial displacement to radians initial_displacement_rad = deg2rad(initial_displacement); % Calculate angular displacement as a function of time angular_displacement =round(initial_displacement_rad * cos(sqrt(gravity/pendulum_length) * time_axis),4); % Find times when angular displacement is maximum and minimum [max_displacement, max_ind] = max(angular_displacement); [min_displacement, min_ind] = min(angular_displacement); max_indices=(angular_displacement==max_displacement); min_indices=(angular_displacement==min_displacement); % Convert indices to time values and round to 4 digits time_at_max_displacement = time_axis(max_indices); time_at_min_displacement = time_axis(min_indices); max_displacement = round(max_displacement, 4); min_displacement = round(min_displacement, 4); % Plotting plot(time_axis, angular_displacement, 'b-', 'LineWidth', 2); hold on; plot(time_at_max_displacement, max_displacement, 'ro', 'MarkerSize', 8, 'MarkerFaceColor', 'r'); hold on; plot(time_at_min_displacement, min_displacement, 'go', 'MarkerSize', 8, 'MarkerFaceColor', 'g'); xlabel('Time (s)'); ylabel('Angular Displacement (rad)'); title('Angular Displacement of Simple Pendulum'); legend('Angular Displacement', 'Max Displacement','Max Displacement', 'Min Displacement'); fprintf("The Number of times angular displacement is maximum : %d\n",sum(max_indices)); fprintf("The Number of times angular displacement is minimum : %d\n",sum(min_indices)); grid on; hold off; Thank you, I'm really stuck on this one and my test is coming up and I would like to know how to solve properly!


This is not a graded assignment but a part of a review I'm studying, please do not reject the question, and thank you in advance for your solution!
My review problem is the attached image that isn't the graph!
I have provided the info from the overall problem here:
g is acceleration due to gravity,
l is pendulum of length 10 cm
and initial displacement theta of 10 degrees.
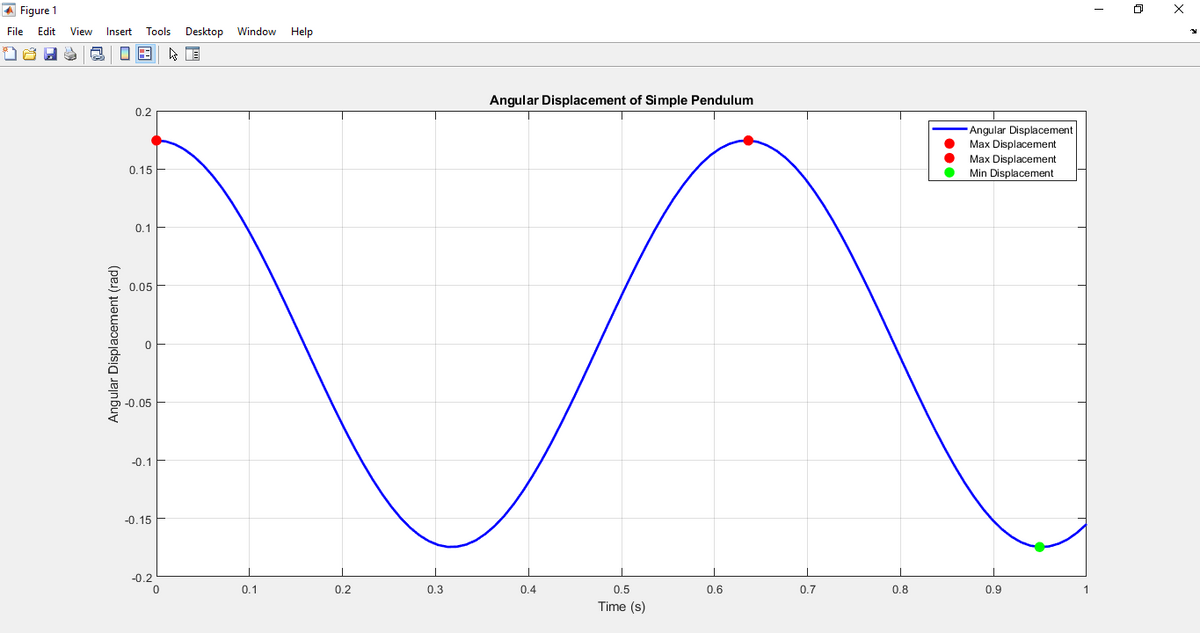
and here is my code solution for part b) as well as the attached graph for b's solution necessary to answering my particular question:
% Given parameters
initial_displacement = 10; % in degrees
pendulum_length = 0.1; % in meters (10 cm)
gravity = 9.81; % acceleration due to gravity in m/s^2
time_points = 100;
time_axis = linspace(0, 1, time_points); % Time axis from 0 to 1 seconds
% Convert initial displacement to radians
initial_displacement_rad = deg2rad(initial_displacement);
% Calculate angular displacement as a function of time
angular_displacement =round(initial_displacement_rad * cos(sqrt(gravity/pendulum_length) * time_axis),4);
% Find times when angular displacement is maximum and minimum
[max_displacement, max_ind] = max(angular_displacement);
[min_displacement, min_ind] = min(angular_displacement);
max_indices=(angular_displacement==max_displacement);
min_indices=(angular_displacement==min_displacement);
% Convert indices to time values and round to 4 digits
time_at_max_displacement = time_axis(max_indices);
time_at_min_displacement = time_axis(min_indices);
max_displacement = round(max_displacement, 4);
min_displacement = round(min_displacement, 4);
% Plotting
plot(time_axis, angular_displacement, 'b-', 'LineWidth', 2);
hold on;
plot(time_at_max_displacement, max_displacement, 'ro', 'MarkerSize', 8, 'MarkerFaceColor', 'r');
hold on;
plot(time_at_min_displacement, min_displacement, 'go', 'MarkerSize', 8, 'MarkerFaceColor', 'g');
xlabel('Time (s)');
ylabel('Angular Displacement (rad)');
title('Angular Displacement of Simple Pendulum');
legend('Angular Displacement', 'Max Displacement','Max Displacement', 'Min Displacement');
fprintf("The Number of times angular displacement is maximum : %d\n",sum(max_indices));
fprintf("The Number of times angular displacement is minimum : %d\n",sum(min_indices));
grid on;
hold off;
Thank you, I'm really stuck on this one and my test is coming up and I would like to know how to solve properly!

Step by step
Solved in 3 steps with 2 images


