This is the step1, so step 2 and step 3 and Step 4 must be answered. (Step 2: Test Statistic -Pearson's r correlation coefficient AND Step 3: Critical Values, and Step 4: Solve For the test stat) so based it from the photo. The table shows the number of hours spend by 30 students in studing and their test scores. Solve for the Pearson’s r and interpret the results. Use 5% significance level. Step 1: Null and Alternative Hypothesis Ho: r = 0; There is no significant relationship between the number of hours spent studying and the students test scores. Ha: r ≠ 0; There is a significant relationship between the number of hours spent studying and the students test scores. Step 2: Test Statistic -P
This is the step1, so step 2 and step 3 and Step 4 must be answered. (Step 2: Test Statistic -Pearson's r correlation coefficient AND Step 3: Critical Values, and Step 4: Solve For the test stat) so based it from the photo. The table shows the number of hours spend by 30 students in studing and their test scores. Solve for the Pearson’s r and interpret the results. Use 5% significance level. Step 1: Null and Alternative Hypothesis Ho: r = 0; There is no significant relationship between the number of hours spent studying and the students test scores. Ha: r ≠ 0; There is a significant relationship between the number of hours spent studying and the students test scores. Step 2: Test Statistic -P

Chapter8: Sequences, Series,and Probability
Section8.6: Counting Principles
Problem 63E: Defective Units A shipment of 25 television sets contains three defective units. In how many ways...

Related questions
Question
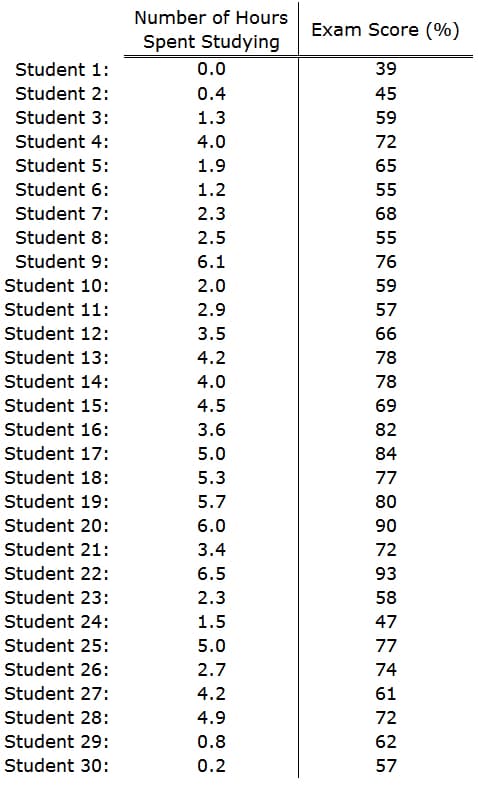
This is the step1, so step 2 and step 3 and Step 4 must be answered. (Step 2: Test Statistic
-Pearson's r correlation coefficient AND Step 3: Critical Values, and Step 4: Solve For the test stat) so based it from the photo. The table shows the number of hours spend by 30 students in studing and their test scores. Solve for the Pearson’s r and interpret the results. Use 5% significance level.
Step 1: Null and Alternative Hypothesis
Ho: r = 0; There is no significant relationship between the number of hours spent studying and the students test scores.
Ha: r ≠ 0; There is a significant relationship between the number of hours spent studying and the students test scores.
Step 2: Test Statistic
-Pearson's r correlation coefficient
Step 3: Critical Values, Step 4: Solve For the test stat
PLEASE SHOW ME COMPLETE SOLUTIONS AND CORRECT ANSWERS THANK YOU!! It was a pleasure to me.
Transcribed Image Text:Student 1:
Student 2:
Student 3:
Student 4:
Student 5:
Student 6:
Student 7:
Student 8:
Student 9:
Student 10:
Student 11:
Student 12:
Student 13:
Student 14:
Student 15:
Student 16:
Student 17:
Student 18:
Student 19:
Student 20:
Student 21:
Student 22:
Student 23:
Student 24:
Student 25:
Student 26:
Student 27:
Student 28:
Student 29:
Student 30:
Number of Hours
Spent Studying
0.0
0.4
1.3
4.0
1.9
1.2
2.3
2.5
6.1
2.0
2.9
3.5
4.2
4.0
4.5
3.6
5.0
5.3
5.7
6.0
3.4
6.5
2.3
1.5
5.0
2.7
4.2
4.9
0.8
0.2
Exam Score (%)
39
45
59
72
65
55
68
55
76
59
57
66
78
78
69
82
84
77
80
90
72
93
58
47
77
74
61
72
62
57
Expert Solution
This question has been solved!
Explore an expertly crafted, step-by-step solution for a thorough understanding of key concepts.

Step by step
Solved in 2 steps with 1 images

Recommended textbooks for you

Algebra and Trigonometry (MindTap Course List)
Algebra
ISBN:
9781305071742
Author:
James Stewart, Lothar Redlin, Saleem Watson
Publisher:
Cengage Learning

Algebra & Trigonometry with Analytic Geometry
Algebra
ISBN:
9781133382119
Author:
Swokowski
Publisher:
Cengage
Algebra and Trigonometry (MindTap Course List)
Algebra
ISBN:
9781305071742
Author:
James Stewart, Lothar Redlin, Saleem Watson
Publisher:
Cengage Learning
Algebra & Trigonometry with Analytic Geometry
Algebra
ISBN:
9781133382119
Author:
Swokowski
Publisher:
Cengage