This table gives a probability that a statistic is less than Z (i.e. between negative infinity and Z). The values are calculated using the cumulative distribution function of a standard normal distribution with mean of zero and standard deviation of one, usually denoted with the capital Greek letter (phi), is the integral IP z/ (z) is related to the error function, or erf(z). (2) = V27 -0-


Continuous Probability Distributions
Probability distributions are of two types, which are continuous probability distributions and discrete probability distributions. A continuous probability distribution contains an infinite number of values. For example, if time is infinite: you could count from 0 to a trillion seconds, billion seconds, so on indefinitely. A discrete probability distribution consists of only a countable set of possible values.
Normal Distribution
Suppose we had to design a bathroom weighing scale, how would we decide what should be the range of the weighing machine? Would we take the highest recorded human weight in history and use that as the upper limit for our weighing scale? This may not be a great idea as the sensitivity of the scale would get reduced if the range is too large. At the same time, if we keep the upper limit too low, it may not be usable for a large percentage of the population!
![Cumulative [ edit]
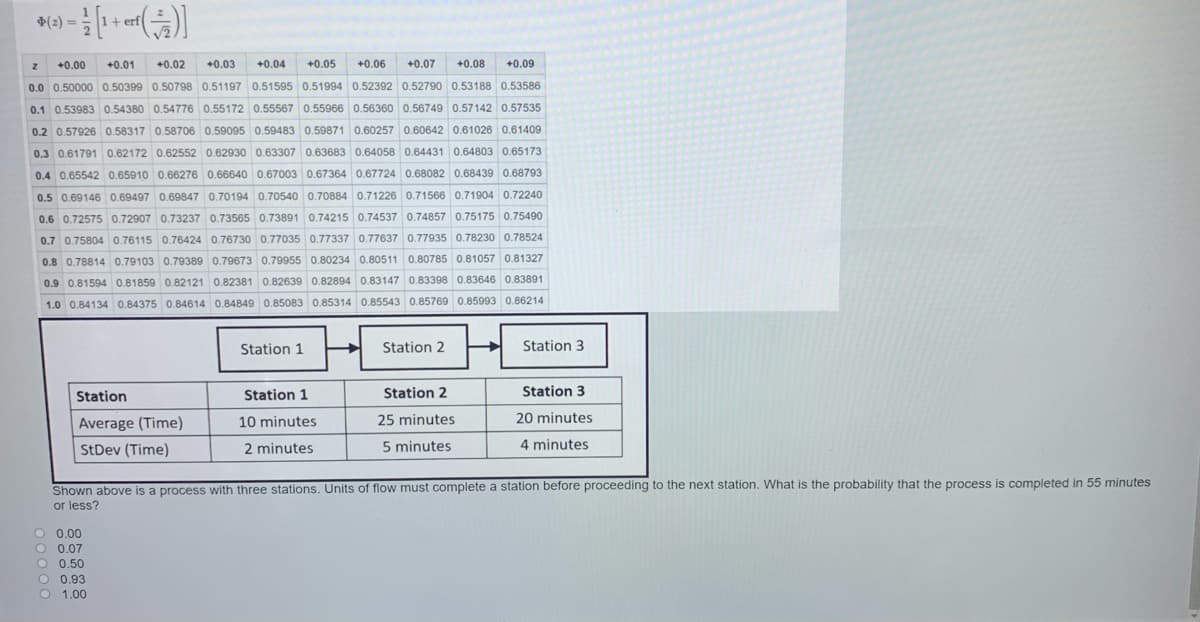
This table gives a probability that a statistic is less than Z (i.e. between negative infinity and Z).
The values are calculated using the cumulative distribution function of a standard normal distribution with mean of zero and standard deviation of one, usually denoted
with the capital Greek letter (phi), is the integral
(2) =
P z/-
(z) is related to the error function, or erf(z).
(2) =
+ erf
+0.00
+0.01
+0.02
+0.03
+0.04
+0.05
+0.06
+0.07
+0.08
+0.09
0.0 0.50000 0.50399 0.50798 0.51197 0,51595 0.51994 0.52392 0,52790 0.53188 0.53586
0.1 0.53983 0.54380 0.54776 0.55172 0.55567 0,55966 0.56360 0.56749 0.57142 0,57535
0.2 0.57926 0.58317 0.58706 0.59095 0.59483 0.59871 0.60257 0.60642 0.61026 0.61409
0.3 0.61791 0.62172 0.62552 0.62930 0.63307 0.63683 0.64058 0.64431 0.64803 0.65173
0.4 0.65542 0.65910 0.66276 0.66640 0.67003 0.67364 0.67724 0.68082 0.68439 0.68793
0.5 0.69146 0.
497 0.69847 0.70194 0.70540 0.70884 0.71226 0.71566 0.71904 0.72240
0.6 0.725750.72907 0.73237 0.73565 0.73891 0.74215 0.74537 0.74857 0.75175 0.75490
0.7 0.75804 0.76115 0.76424 0.76730 0.77035 0.77337 0.77637 0.77935 0.78230 0.78524
0.8 0.78814 0.79103 0.79389 0.79673 0.79955 0.80234 0.80511 0.80785 0.81057 0.81327
0.9 0.81594 0.81859 0.82121 0.82381 0.82639 0.82894 0.83147 0.83398 0.83646 0.83891
1.0 0.84134 0.84375 0.84614 0.84849 0.85083 0.85314 0.85543 0.85769 0.85993 0.86214
Station 1
Station 2
Station 3
Station
Station 1
Station 2
Station 3
Average (Time)
10 minutes
25 minutes
20 minutes
StDev (Time)
2 minutes
5 minutes
4 minutes](/v2/_next/image?url=https%3A%2F%2Fcontent.bartleby.com%2Fqna-images%2Fquestion%2F8c763407-1da0-4416-b85c-a65141b317ad%2Fe036add6-7898-4e38-b335-9847e197396a%2F2v3kw5f_processed.jpeg&w=3840&q=75)

Step by step
Solved in 2 steps


