This table shows the number of subscribers to a video streaming service in the first six years after it was founded. Year 2016 2017 2018 2019 2020 2021 Subscribers 182,000 304,000 433,000 669,000 1,027,000 1,356,000 What was the average rate of change in the number of subscribers between 2017 and 2020?
This table shows the number of subscribers to a video streaming service in the first six years after it was founded. Year 2016 2017 2018 2019 2020 2021 Subscribers 182,000 304,000 433,000 669,000 1,027,000 1,356,000 What was the average rate of change in the number of subscribers between 2017 and 2020?

Chapter3: Functions
Section3.3: Rates Of Change And Behavior Of Graphs
Problem 1TI: Using the data in Table 1 at the beginning of this section, find the average rate of change between...

Related questions
Question
Transcribed Image Text:6
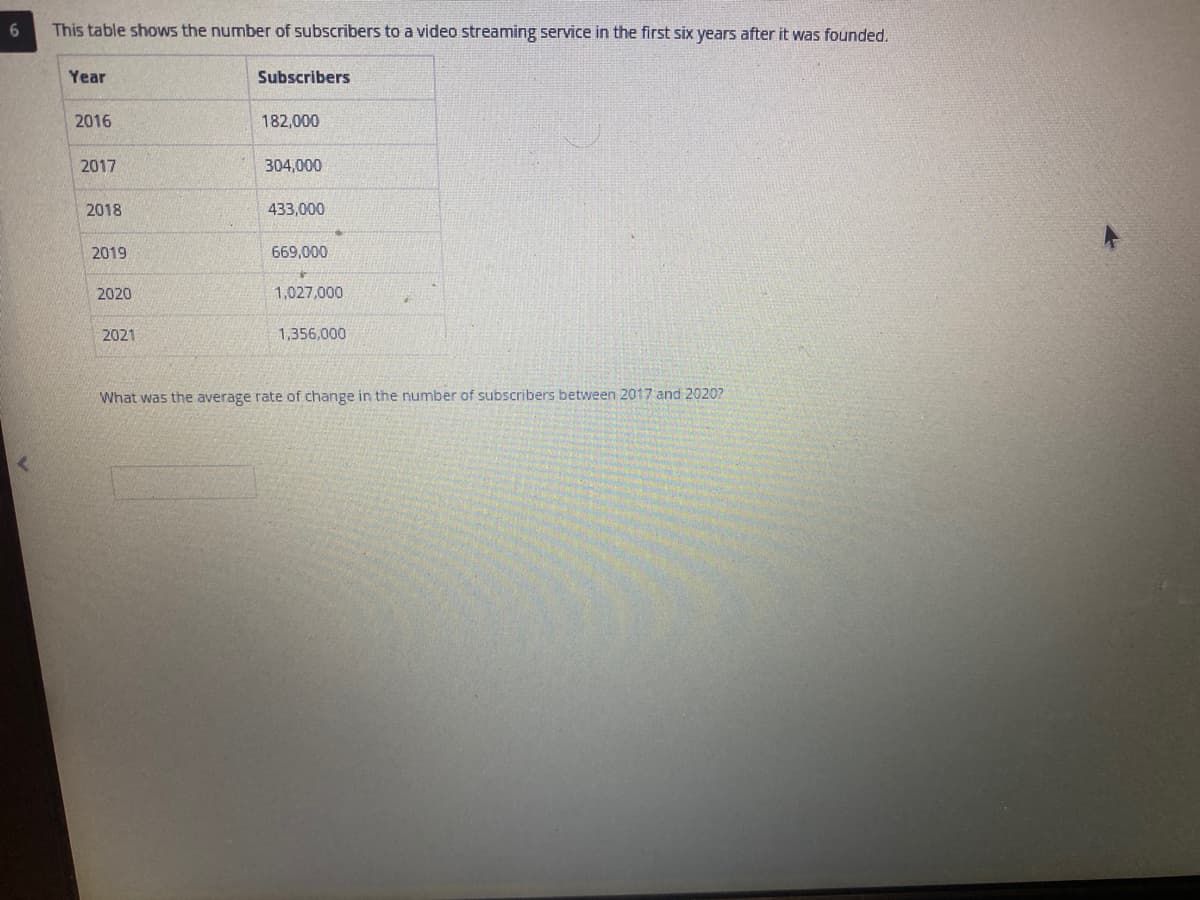
This table shows the number of subscribers to a video streaming service in the first six years after it was founded.
Year
2016
2017
2018
2019
2020
2021
Subscribers
182,000
304,000
433,000
669,000
1,027,000
1,356,000
What was the average rate of change in the number of subscribers between 2017 and 2020?
Expert Solution
This question has been solved!
Explore an expertly crafted, step-by-step solution for a thorough understanding of key concepts.

This is a popular solution!

Trending now
This is a popular solution!

Step by step
Solved in 3 steps with 5 images

Recommended textbooks for you

Glencoe Algebra 1, Student Edition, 9780079039897…
Algebra
ISBN:
9780079039897
Author:
Carter
Publisher:
McGraw Hill

Big Ideas Math A Bridge To Success Algebra 1: Stu…
Algebra
ISBN:
9781680331141
Author:
HOUGHTON MIFFLIN HARCOURT
Publisher:
Houghton Mifflin Harcourt
Glencoe Algebra 1, Student Edition, 9780079039897…
Algebra
ISBN:
9780079039897
Author:
Carter
Publisher:
McGraw Hill
Big Ideas Math A Bridge To Success Algebra 1: Stu…
Algebra
ISBN:
9781680331141
Author:
HOUGHTON MIFFLIN HARCOURT
Publisher:
Houghton Mifflin Harcourt

Linear Algebra: A Modern Introduction
Algebra
ISBN:
9781285463247
Author:
David Poole
Publisher:
Cengage Learning