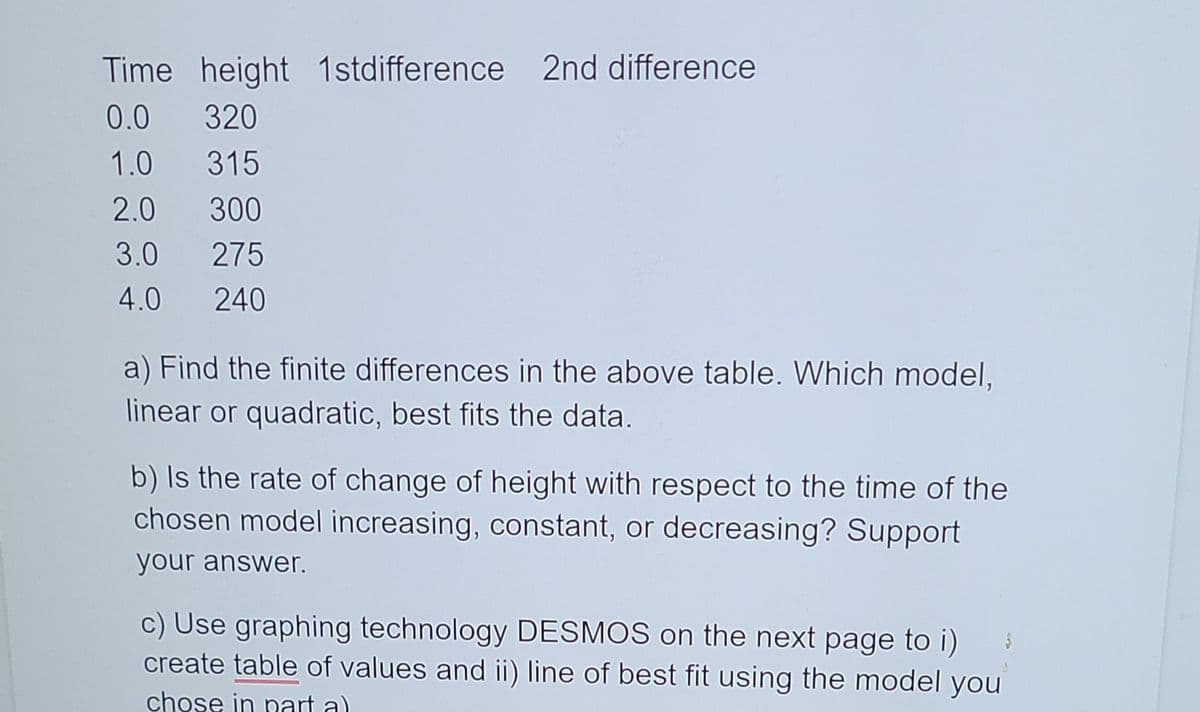
Time height 1stdifference 2nd difference 0.0 320 1.0 315 2.0 300 3.0 275 4.0 240 a) Find the finite differences in the above table. Which model, linear or quadratic, best fits the data. b) Is the rate of change of height with respect to the time of the chosen model increasing, constant, or decreasing? Support your answer. c) Use graphing technology DESMOS on the next page to i) create table of values and ii) line of best fit using the model you chose in nart a)
Time height 1stdifference 2nd difference 0.0 320 1.0 315 2.0 300 3.0 275 4.0 240 a) Find the finite differences in the above table. Which model, linear or quadratic, best fits the data. b) Is the rate of change of height with respect to the time of the chosen model increasing, constant, or decreasing? Support your answer. c) Use graphing technology DESMOS on the next page to i) create table of values and ii) line of best fit using the model you chose in nart a)

Algebra & Trigonometry with Analytic Geometry
13th Edition
ISBN:9781133382119
Author:Swokowski
Publisher:Swokowski
Chapter3: Functions And Graphs
Section3.3: Lines
Problem 76E

Related questions
Question
Transcribed Image Text:Time height 1stdifference 2nd difference
0.0
320
1.0
315
2.0
300
3.0
275
4.0
240
a) Find the finite differences in the above table. Which model,
linear or quadratic, best fits the data.
b) Is the rate of change of height with respect to the time of the
chosen model increasing, constant, or decreasing? Support
your answer.
c) Use graphing technology DESMOS on the next page to i)
create table of values and ii) line of best fit using the model you
chose in nart a)
Expert Solution
This question has been solved!
Explore an expertly crafted, step-by-step solution for a thorough understanding of key concepts.

Step by step
Solved in 5 steps with 2 images

Recommended textbooks for you
Algebra & Trigonometry with Analytic Geometry
Algebra
ISBN:
9781133382119
Author:
Swokowski
Publisher:
Cengage

Functions and Change: A Modeling Approach to Coll…
Algebra
ISBN:
9781337111348
Author:
Bruce Crauder, Benny Evans, Alan Noell
Publisher:
Cengage Learning
Algebra & Trigonometry with Analytic Geometry
Algebra
ISBN:
9781133382119
Author:
Swokowski
Publisher:
Cengage
Functions and Change: A Modeling Approach to Coll…
Algebra
ISBN:
9781337111348
Author:
Bruce Crauder, Benny Evans, Alan Noell
Publisher:
Cengage Learning