To test for normality, an ogive of a set of data can be drawn on probability paper. An ogive is a line graph of a cumulative frequency or cumulative relative frequency distribution. Note the probability plot below. Probability Plot Normal 99 95 90 80 10 5 15 20 10 Data values If the ordered pair points (data value, cumulative probability) follow fairly closely to the sketched straight line, the set of data can be considered approximately normally distributed. Part 1 of 3 Note how the vertical scale on the probability plot is not uniform. How does that correspond to a normal distribution? Percent 30 20 T I
To test for normality, an ogive of a set of data can be drawn on probability paper. An ogive is a line graph of a cumulative frequency or cumulative relative frequency distribution. Note the probability plot below. Probability Plot Normal 99 95 90 80 10 5 15 20 10 Data values If the ordered pair points (data value, cumulative probability) follow fairly closely to the sketched straight line, the set of data can be considered approximately normally distributed. Part 1 of 3 Note how the vertical scale on the probability plot is not uniform. How does that correspond to a normal distribution? Percent 30 20 T I

Glencoe Algebra 1, Student Edition, 9780079039897, 0079039898, 2018
18th Edition
ISBN:9780079039897
Author:Carter
Publisher:Carter
Chapter10: Statistics
Section10.4: Distributions Of Data
Problem 19PFA

Related questions
Question
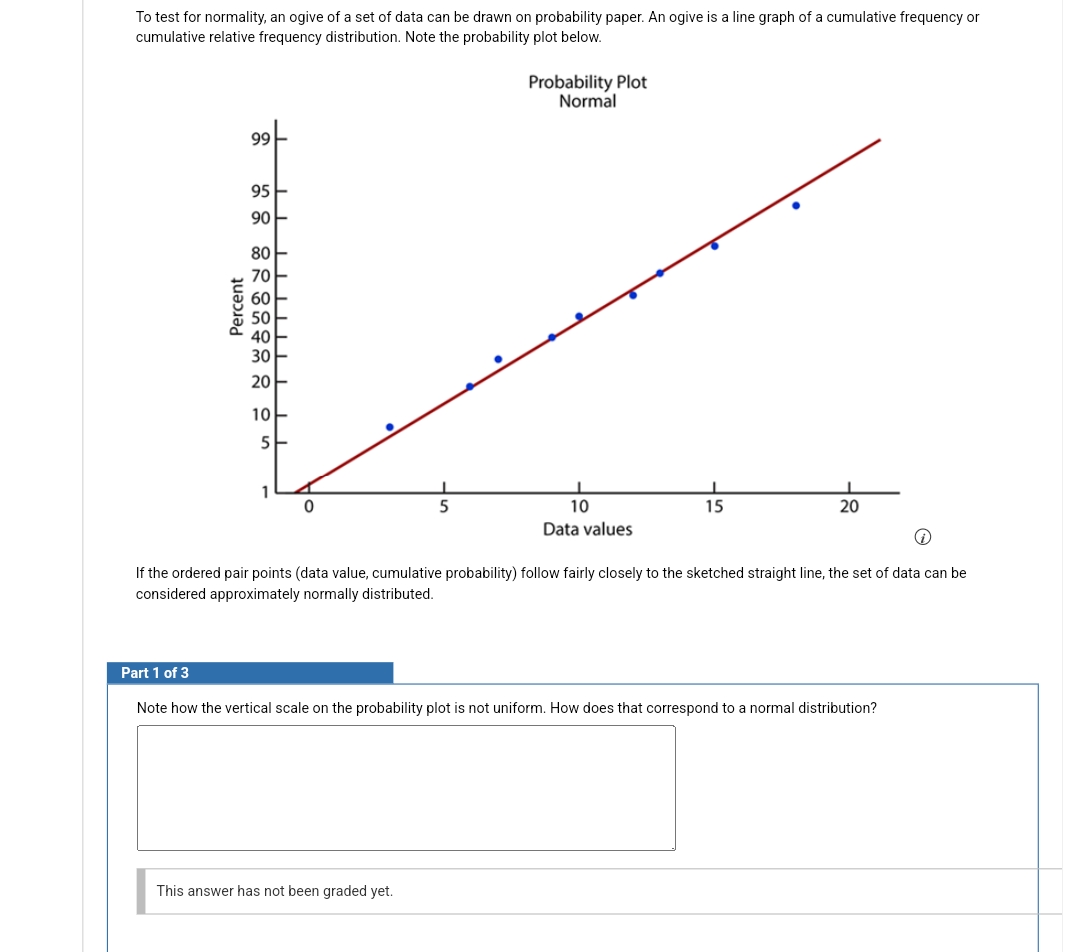
Transcribed Image Text:To test for normality, an ogive of a set of data can be drawn on probability paper. An ogive is a line graph of a cumulative frequency or
cumulative relative frequency distribution. Note the probability plot below.
Probability Plot
Normal
99
95
90
80
70
60
50
30
20
10
5
I
0
5
10
15
Data values
20
↑
If the ordered pair points (data value, cumulative probability) follow fairly closely to the sketched straight line, the set of data can be
considered approximately normally distributed.
Part 1 of 3
Note how the vertical scale on the probability plot is not uniform. How does that correspond to a normal distribution?
This answer has not been graded yet.
Percent
▬▬▬▬▬▬▬▬▬▬▬▬▬▬▬▬▬▬▬▬▬▬▬▬▬▬▬▬▬▬▬▬▬▬▬▬▬▬▬
Expert Solution
This question has been solved!
Explore an expertly crafted, step-by-step solution for a thorough understanding of key concepts.

This is a popular solution!

Trending now
This is a popular solution!

Step by step
Solved in 2 steps

Recommended textbooks for you
Glencoe Algebra 1, Student Edition, 9780079039897…
Algebra
ISBN:
9780079039897
Author:
Carter
Publisher:
McGraw Hill
Glencoe Algebra 1, Student Edition, 9780079039897…
Algebra
ISBN:
9780079039897
Author:
Carter
Publisher:
McGraw Hill