total revenue indutry revenue Cost of goods sold Gross Profit Operating Expenses Operating Profit Operating Profit Margin $ $ $ $ $ 2017 2,416,585.00 $ 1,592,450.00 $ 824,135.00 $ 404,165.00 $ 419,970.00 $ 17% 2018 2,427,515.00 $ 0.45% 2019 1,582,740.00 $ 844,775.00 $ 409,521.00 $ 435,254.00 $ 18% 2,348,789.00 $ -3.24% $ 29,400,000,000.00 $ 27,900,000,000.00 $ 22,560,000,000.00 $ 26,300,000,000.00 -5.10% 1,502,363.00 $ 846,426.00 $ 442,587.00 $ 403,839.00 $ 2020 17% 1,850,690.00 $ -21.21% -19.14% 1,239,962.00 $ 610,728.00 $ 396,452.00 $ 214,276.00 $ 20201 2,170,060.00 17.26% 12% 16.58% 1,375,818.00 794,242.00 478,926.00 315,316.00 15%
total revenue indutry revenue Cost of goods sold Gross Profit Operating Expenses Operating Profit Operating Profit Margin $ $ $ $ $ 2017 2,416,585.00 $ 1,592,450.00 $ 824,135.00 $ 404,165.00 $ 419,970.00 $ 17% 2018 2,427,515.00 $ 0.45% 2019 1,582,740.00 $ 844,775.00 $ 409,521.00 $ 435,254.00 $ 18% 2,348,789.00 $ -3.24% $ 29,400,000,000.00 $ 27,900,000,000.00 $ 22,560,000,000.00 $ 26,300,000,000.00 -5.10% 1,502,363.00 $ 846,426.00 $ 442,587.00 $ 403,839.00 $ 2020 17% 1,850,690.00 $ -21.21% -19.14% 1,239,962.00 $ 610,728.00 $ 396,452.00 $ 214,276.00 $ 20201 2,170,060.00 17.26% 12% 16.58% 1,375,818.00 794,242.00 478,926.00 315,316.00 15%

Chapter5: Operating Activities: Purchases And Cash Payments
Section: Chapter Questions
Problem 1.6C

Related questions
Question
Ma4.
Hello,
Please analyze this firm's performance if the revenue is increasing or decreasing compared to the industry average or if the profitability is stable or rising. Please include if the company needs to create or capture value or if they are creating or capturing value.
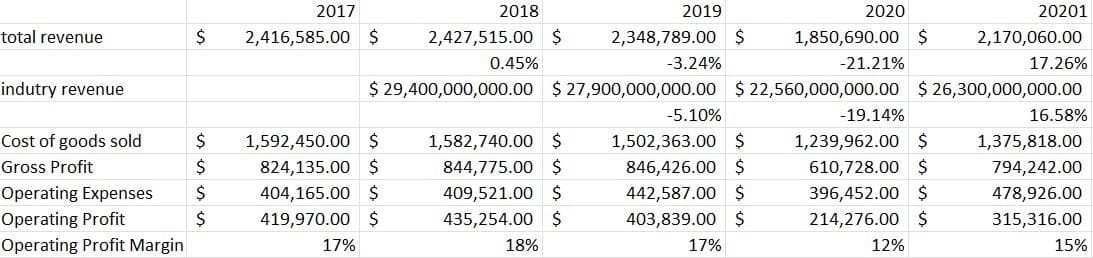
Transcribed Image Text:total revenue
indutry revenue
Cost of goods sold
Gross Profit
Operating Expenses
Operating Profit
Operating Profit Margin
$
$
$
$
Ś
2017
2,416,585.00 $
1,592,450.00 $
824,135.00 $
404,165.00 $
419,970.00 $
17%
2018
2,427,515.00 $ 2,348,789.00 $
-3.24%
0.45%
2019
1,582,740.00 $
844,775.00 $
409,521.00 $
435,254.00 $
18%
$ 29,400,000,000.00 $ 27,900,000,000.00 $ 22,560,000,000.00 $ 26,300,000,000.00
-5.10%
1,502,363.00 $
846,426.00 $
442,587.00 $
403,839.00 $
2020
17%
1,850,690.00 $ 2,170,060.00
-21.21%
17.26%
20201
-19.14%
1,239,962.00 $
610,728.00 $
396,452.00 $
214,276.00 $
12%
16.58%
1,375,818.00
794,242.00
478,926.00
315,316.00
15%
Expert Solution
This question has been solved!
Explore an expertly crafted, step-by-step solution for a thorough understanding of key concepts.

Step by step
Solved in 2 steps

Knowledge Booster


Learn more about
Need a deep-dive on the concept behind this application? Look no further. Learn more about this topic, accounting and related others by exploring similar questions and additional content below.Recommended textbooks for you

Cornerstones of Financial Accounting
Accounting
ISBN:
9781337690881
Author:
Jay Rich, Jeff Jones
Publisher:
Cengage Learning

Intermediate Accounting: Reporting And Analysis
Accounting
ISBN:
9781337788281
Author:
James M. Wahlen, Jefferson P. Jones, Donald Pagach
Publisher:
Cengage Learning
Cornerstones of Financial Accounting
Accounting
ISBN:
9781337690881
Author:
Jay Rich, Jeff Jones
Publisher:
Cengage Learning
Intermediate Accounting: Reporting And Analysis
Accounting
ISBN:
9781337788281
Author:
James M. Wahlen, Jefferson P. Jones, Donald Pagach
Publisher:
Cengage Learning

Financial And Managerial Accounting
Accounting
ISBN:
9781337902663
Author:
WARREN, Carl S.
Publisher:
Cengage Learning,

Fundamentals of Financial Management (MindTap Cou…
Finance
ISBN:
9781337395250
Author:
Eugene F. Brigham, Joel F. Houston
Publisher:
Cengage Learning