Transform f(z) into g(x) where the transformation is g(x) = f(x) +1 %3D The function f(x) is shown below in red. Graph the transformed function g(x) by first placing a dot at each end point of the new transformed function and then click on the "line segment" button and connect the two blue dots. (Hint: Use pattern-matching to determine the values of the constants A, B, H, and K.) 5- -6 -5 -4 -3-2 5 6 2. 3. 2.
Transform f(z) into g(x) where the transformation is g(x) = f(x) +1 %3D The function f(x) is shown below in red. Graph the transformed function g(x) by first placing a dot at each end point of the new transformed function and then click on the "line segment" button and connect the two blue dots. (Hint: Use pattern-matching to determine the values of the constants A, B, H, and K.) 5- -6 -5 -4 -3-2 5 6 2. 3. 2.

Algebra & Trigonometry with Analytic Geometry
13th Edition
ISBN:9781133382119
Author:Swokowski
Publisher:Swokowski
Chapter3: Functions And Graphs
Section3.5: Graphs Of Functions
Problem 36E

Related questions
Question
100%
Transcribed Image Text:New Tab
Precalc ISM 01.05
myopenmath.com
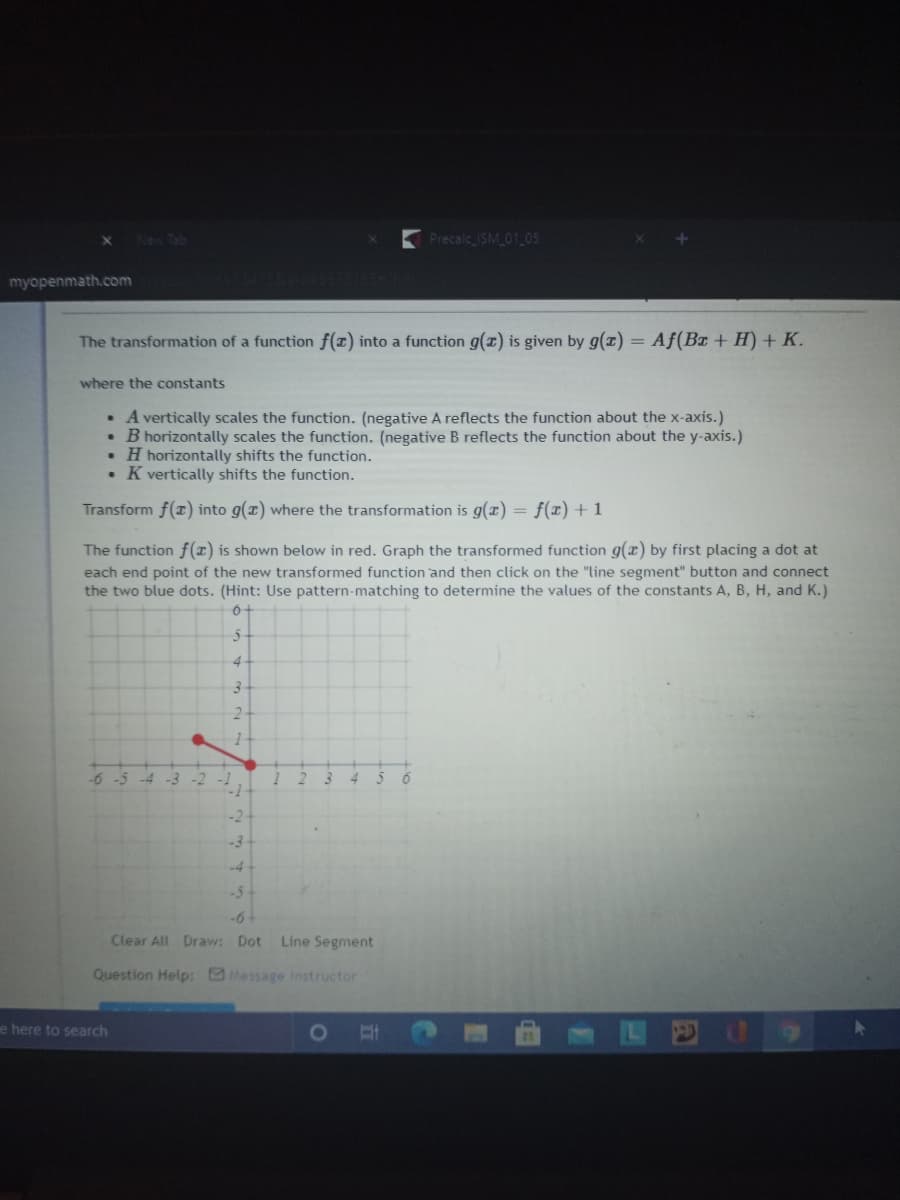
The transformation of a function f(z) into a function g(z) is given by g(z) =
Af(Br + H) + K.
where the constants
• A vertically scales the function. (negative A reflects the function about the x-axis.)
• B horizontally scales the function. (negative B reflects the function about the y-axis.)
• H horizontally shifts the function.
K vertically shifts the function.
Transform f(r) into g(x) where the transformation is g(x) = f(x) + 1
The function f(x) is shown below in red. Graph the transformed function g(x) by first placing a dot at
each end point of the new transformed function and then click on the "line segment" button and connect
the two blue dots. (Hint: Use pattern-matching to determine the values of the constants A, B, H, and K.)
3-
2-
-6-5
-4 -3 -2
-2
-3
-6-
Clear All Draw: Dot Line Segment
Question Help: Message instructor
e here to search
Expert Solution
This question has been solved!
Explore an expertly crafted, step-by-step solution for a thorough understanding of key concepts.

This is a popular solution!

Trending now
This is a popular solution!

Step by step
Solved in 2 steps with 1 images

Knowledge Booster


Learn more about
Need a deep-dive on the concept behind this application? Look no further. Learn more about this topic, calculus and related others by exploring similar questions and additional content below.Recommended textbooks for you
Algebra & Trigonometry with Analytic Geometry
Algebra
ISBN:
9781133382119
Author:
Swokowski
Publisher:
Cengage
Algebra & Trigonometry with Analytic Geometry
Algebra
ISBN:
9781133382119
Author:
Swokowski
Publisher:
Cengage