Trend Model: Demand 313 0.2364 (Month) Period 1 Forecast Error Sq Error Exponential Smoothing: a 0.4 1 Period Forecast 313.24 10.76 115.86 Error Sq Error #N/A #N/A #N/A 3-period Moving Average Perind 1 2 313.47 -2.47 6.11 2 324.00 -13.00 169.00 313.71 10.71 114.68 318.80 -15.80 249.64 HOLLA 313.95 0.05 0.00 312.48 1.52 2.31 312.67 314.18 8.82 77.76 5 313.09 9.91 98.25 309.33 6 314.42 -1.42 2.01 6 317.05 -4.05 16.43 313.33 7 314.65 -12.65 160.14 L 315.43 -11.43 180.41 316.67 1467 314.89 0.11 0.01 310.06 4.94 24.41 315 312.67 2.33
Trend Model: Demand 313 0.2364 (Month) Period 1 Forecast Error Sq Error Exponential Smoothing: a 0.4 1 Period Forecast 313.24 10.76 115.86 Error Sq Error #N/A #N/A #N/A 3-period Moving Average Perind 1 2 313.47 -2.47 6.11 2 324.00 -13.00 169.00 313.71 10.71 114.68 318.80 -15.80 249.64 HOLLA 313.95 0.05 0.00 312.48 1.52 2.31 312.67 314.18 8.82 77.76 5 313.09 9.91 98.25 309.33 6 314.42 -1.42 2.01 6 317.05 -4.05 16.43 313.33 7 314.65 -12.65 160.14 L 315.43 -11.43 180.41 316.67 1467 314.89 0.11 0.01 310.06 4.94 24.41 315 312.67 2.33

A First Course in Probability (10th Edition)
10th Edition
ISBN:9780134753119
Author:Sheldon Ross
Publisher:Sheldon Ross
Chapter1: Combinatorial Analysis
Section: Chapter Questions
Problem 1.1P: a. How many different 7-place license plates are possible if the first 2 places are for letters and...

Related questions
Question
J 2
please help
Transcribed Image Text:Period
Forecast
Error
Sq Error
Month
1
3
3
4
Error
Sq Error
15
6
Error
Sq Error
7
B
9
10
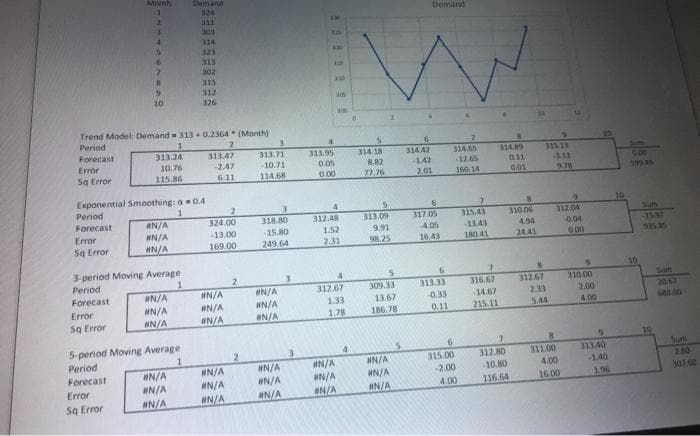
Trend Model: Demand= 313 0.2364 (Month)
Period
1
Forecast
Error
Sq Error
313.24
10.76
115.86
Exponential Smoothing: a 0.4
1
3-period Moving Average
Period
1
Forecast
#N/A
#N/A
#N/A
#N/A
#N/A
#N/A
5-period Moving Average
Period
1
Forecast
Demand
324
311
303
314
#N/A
#N/A
#N/A
323
313
302
315
312
326
313.47
-2.47
6.11
2
324.00
-13.00
169,00
#N/A
#N/A
#N/A
#N/A
#N/A
#N/A
2
2
313.71
-10.71.
114.68
3
318.80
-15.80
249.64
#N/A
#N/A
#N/A
#N/A
#N/A
#N/A
3
3
ASBER11
4
313.95
0.05
0.00
4
312.48
1.52
2.31
4
312.67
1.33
1.78
#N/A
#N/A
#N/A
4
53
314.18
8.82
77.76
5
313.09
9.91
98.25
5
309.33
13.67
186.78
#N/A
#N/A
#N/A
314 42
1.42
2.01
Demand
6
317.05
-4.05
16.43
6
313.33
-0.33
0.11
7
314.65
-12.65
160.14
6
315.00
-2.00
4.00
7
315.43
-1343
180.41
7
316.67
-14.67
215.11
314.89
0.11
0.01
312.80
-10.80
116.64
8
310.06
4.94
24.41
315.13
-3.33
312.67
2.33
5.44
312.04
8
311.00
4.00
16.00
-0.04
0.00
310.00
2.00
4.00
9
313.40
-1.40
1.96
10
399.00
10
Sum
935.AS
10
20.67
680.00
Sum
1.80
301.00
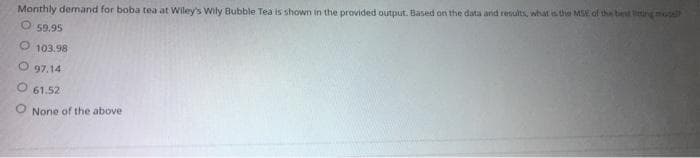
Transcribed Image Text:Monthly demand for boba tea at Wiley's Wily Bubble Tea is shown in the provided output. Based on the data and results, what is the MSE of the best ting model
59.95
O 103.98
O97.14
O 61.52
O None of the above
Expert Solution
This question has been solved!
Explore an expertly crafted, step-by-step solution for a thorough understanding of key concepts.

Step by step
Solved in 6 steps with 1 images

Recommended textbooks for you
A First Course in Probability (10th Edition)
Probability
ISBN:
9780134753119
Author:
Sheldon Ross
Publisher:
PEARSON

A First Course in Probability (10th Edition)
Probability
ISBN:
9780134753119
Author:
Sheldon Ross
Publisher:
PEARSON