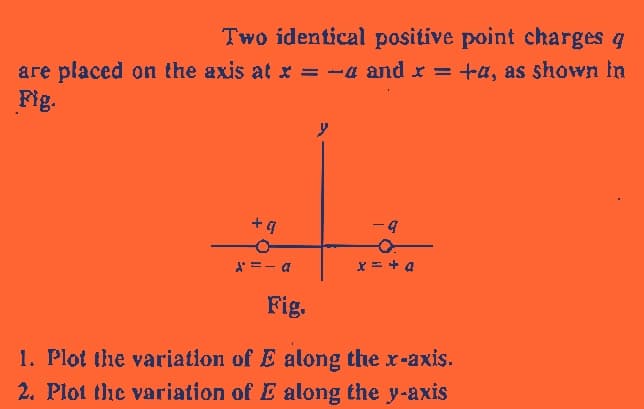
Two identical positive point charges q are placed on the axis at x = -a and x = +a, as shown in Fig. +4 Fig. y 9 x = + a

Q: Q3: use the method of Lagrange undetermined multipliers to find the acceleration of the system shown…
A: Lagrangian mechanics is a form of classical mechanics that was developed in physics and is based on…
Q: 1. Kilometro. A 4.20 [kg] frictionless block is attached to an ideal spring of force constant 704.…
A: A)
Q: Two particles, each having a mass of 5 g and charge 10-7 C, stay in limiting equilibrium on a hori-…
A:
Q: Two point-like charges a and b whose strengths are equal in absolute value are positioned at a cer-…
A:
Q: 2.15. In a hexagonal unit cell, indicate the following planes and direc- tions: (1210), (1012),…
A: For cubic crystals : [100], [1¯00], [010], [01¯0], [001], [001¯] are the equivalent directions…
Q: 00100 POST10-$+27-20-17045 Kaguravu Mjamd 20 pel Apand came at you comente en jaqi.comS
A:
Q: X2. The magnitude of the electric field between the two circular parallel plates in figure below is…
A:
Q: A space shuttle lands on a distant planet where the gravitational acceleration is 2.0 ( We do not…
A:
Q: Point charges are placed at the vertices of a square of side a as shown in Fig. What should be sign…
A:
Q: In a game of freeze, a person freezes into a position shown below. As a percentage of total body…
A: Given:total mass of the body, m = 75 kgpercentage distribution of mass is,head: 10%arms: 10%trunk:…
Q: Question 8 A car's bumper is designed to withstand a 4.0-km/h (1.12-m/s) collision with an immovable…
A:
Q: A service station charges a battery using a current of 6.1 A for 7.1 h. Howmuch charge passes…
A: Given: Here, the given details are, A service station charges a battery using a current of 6.1 A for…
Q: A ball is dropped from a certain height. t₁ is just before it is dropped and t2 is just before it…
A: We are given LOL diagram. We identify each of the energies that is kinetic energy and potential…
Q: When current flows through a wire protons are moving opposite the direction of the current. protons…
A: The current flow in a conductor is made up of many free electrons, which make up the conductor.These…
Q: (d) Calculate the normal force on the wall from a rider of mass 55 kg? N= N (e) Calculate the…
A: Step 1: Given: The radius of the cylindrical room = 7m Frequency of revolution of the room = 15.5…
Q: How much louder (in dB) is a sound wave with I₁ = 3.4 x 10⁻⁵ W/m² than another sound wave with…
A:
Q: Why does a capacitor act as a short circuit at high frequencies and as an open circuit at low…
A: Capacitors are a passive electrical element that is capable of storing energy as electric fields in…
Q: Find all eigenvalues and eigenvectors of the Hamiltonian defined over the Hilbert space of two…
A:
Q: Figure 4(a) shows a force P applied to a crate on a rough floor. The mass of the crate is 50 kg, b =…
A: Disclaimer: “Since you have asked multiple question, we will solve the first question for you. If…
Q: A fairground ride spins its occupants inside a flying saucer-shaped container. If the horizontal…
A: Given: In this question, the given details are, A fairground ride spins its occupants inside a…
Q: Ē P What will happen when a positively charged particle is, moving through an electric field, in the…
A: We know that the wavelength for proton and electron is given by Wavelength=12.24/(√V) A° Hence the…
Q: A 115- resistor, a 67 6-mH inductor, and a 189-μF capacitor are connected in series to an ac…
A: We have to find the frequency at which the current will be maximum. The RLC circuit's resistance is…
Q: Find eigenvalues and eigenfunctions of the boundary value problem y(1) = 0, y(2) = 0. 2 x²y" = xy,
A:
Q: An airplane accelerates at 3.00 m/s² from a velocity of 21.0 m/s over a distance of 535 m. What is…
A: Knowing that an aeroplane accelerates at a rate of 3 m/s2 over a distance of 535 m from a velocity…
Q: Question 19 You are standing on the shore of a lake. You spot a tasty fish swimming some distance…
A:
Q: A square loop is placed in the uniform magnetic field as shown in the figure. The magnetic field…
A: As per Faraday 's law, in case of change in magnetic flux an end will be induced. This emf causes…
Q: A particle of mass m carrying a charge -1 starts moving around a fixed charge +92 along a circular…
A:
Q: Two lenses are placed along an optical rail. One is a converging lens, with a focal length of f1 =…
A: Disclaimer: “Since you have asked posted a question with multiple sub-parts, we will solve the first…
Q: Assume you are a perfect blackbody at a temperature of T = 310 K. What is the rate, in watts, at…
A: Given: In this question, the given details are, The given temperature is T=310 K. To find the value…
Q: 1) W---! A 1550 kg spacecraft is moving sideways in deep space (so you don't have to worry about…
A:
Q: H.W. 3 A sphere of radius b [m] carries a volume charge density of p, [C/m³]. Inside this sphere…
A: The electric field by the spherical solid is calculated by electric flux, the total electric flux is…
Q: A wire carries a current of 0.91 A. This wire makes an angle of 48° with respect to a magnetic field…
A: Given: Current(I)=0.91A Angle=48o Magnetic force(F)=7.3*10-5N Magnetic field(B)=5.8*10-5T To find:…
Q: A new liquid substance has been discovered that freezes at 28° C and has a latent heat of 623,000…
A:
Q: Find the total force necessary to give an automobile of mass 120 slugs an acceleration of 11.0…
A: Given : Mass (m)=120slugs=1751.268Kg Acceleration (a)=11ft/s2=3.3528m/s2 To find: Force (F)
Q: Imagine moving along the axis of the current-carrying loop in the figure below, starting at a point…
A: The magnetic field due to the current carrying loop is dependent on the current flowing through the…
Q: A small spaceship cruises the solar system using an ideal, square absorbing solar sail with side…
A: Given:length of the square sail, L = 1000 m intensity of solar radiation at earth, Ie = 1300…
Q: Although an incandescent lightbulb appears to shine with constant intensity, this is an artifact of…
A: It must be determined whether the incandescent light bulb will reach its maximum brightness 60 or…
Q: In an electric shaver, the blade moves back and forth over a distance of 1.8 mm in simple harmonic…
A: We are given the the distance between the maximum amplitude and minimum amplitude. We know that…
Q: on
A: Given: Mass is 50 kg Distance is 0.3 m
Q: !,@, (i) r₁ = (8800.00 ƒ) km and v = (0.943736 -6.31469 k) km/s and i (ii). r₁ = (3818.14 i +8148.07…
A: Solution: Let us calculate the following classical orbital elements for the given velocity and…
Q: 3. On the way to Petco, Mr. Chapman puts his 20kg dog Khan in a 35kg wagon and rolls him into the…
A: We are given mass of dog and wagon. Both dog and wagon forms a system. This means they both come in…
Q: Physical Pendulum... A physical pendulum is made from a thin uniform 4 kg rod that is 1.5 meters in…
A: We have to calculate moment of inertia of both rods about the hinge point. Then from that we can…
Q: Ex/32: Two equal resistances are introduced two gaps of meter bridge find the shift in null point if…
A: We need to compute-Shift in null point.The data given as-Let resistance of each resistor connected…
Q: 1. Is the field uniform? 2. Determine the ratio 94. 4B 3. What are the sign of q, and qB?
A: Electric field is a 3D space where the effect of electric force can be experienced. Electric field…
Q: The energy eigenvalues of a particle in a 3-D box of dimensions (a, b, c) is given by ny E(nx, ny,…
A:
Q: 6.10. A certain material having atomic radius of 1.5 Å can exhibit either an FCC or BCC structure in…
A:
Q: want to lower a suspended load in a controlled way so that it hits the ground with a speed whose…
A: Solution: Let T be the tension in the string, Then according to Newton's second law of motion for…
Q: An airplane accelerates at 3.00 m/s² from a velocity of 21.0 m/s over a distance of 535 m. What is…
A: We need to determine the airplane's ultimate velocity because we know it accelerates across a…
Q: A relief airplane is delivering a food package to a group of people stranded on a very small island.…
A:
Q: A cell of e.m.f. 2V and external resistance 0.5 2 is connected across a resistor (R). The current…
A: We need to compute-External resistance (R)=?The data given as-E=2 Vr1=0.5 ohmE2=1.5 Vr2=0.3…

Step by step
Solved in 2 steps with 2 images
