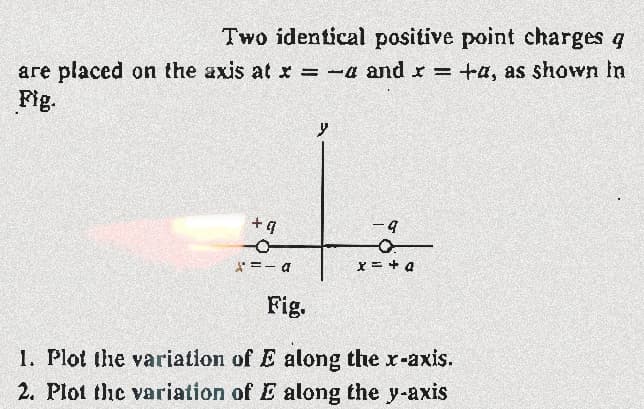
Two identical positive point charges q are placed on the axis at x = -a and x = +a, as shown in Fig. +q -O X=-a Fig. y 9 x = + a 1. Plot the variation of E along the x-axis. 2. Plot the variation of E along the y-axis

Q: II. Convert the following measurements. 1) 2.50 atm to Pa 2) 1.25 km/h to mi/day
A: Need to determine 1) 2.50 atm to Pascal 2) 1.25km/hr to mi/day
Q: Find the total force necessary to give a rocket of mass 25,000 slugs an acceleration of 28.0 ft/s².
A: We have to find the force require for the mass of 25000 slugs to give an acceleration of 28.0 ft/s2.…
Q: A block of mass m = 2.00 kg is attached to a spring of force constant k = 570 N/m as shown in the…
A: Given: In this question, the given details are, A block of mass m=2.00 kg is attached to a spring of…
Q: 3. A solenoid of length 9.00 cm and diameter 1.50 cm has 985 windings on it. Inside the solenoid is…
A: We are given radius and length of solenoid. We are also given the number of turns in it. We find the…
Q: Corner Reflector A corner reflector is to be made from a glass triangular prism with index of…
A:
Q: In an engine, a piston oscillates with simple harmonic motion so that its position varies according…
A: Given: In the Simple Harmonic motion of the piston, the displacement of the piston with time is…
Q: A cylindrical wooden rod with diameter 2 cm and length 8 cm has a specific gravity of 0.85 and…
A:
Q: A horizontal force of magnitude 33.8 N pushes a block of mass 4.01 kg across a floor where the…
A: (a) Here given in question the amount of horizontal force applied to the block is F=33.8 Newton…
Q: Suppose that the light carries energy Elight. What is the maximum stopping potential Vo that can be…
A: Answer: B) Vo = (Elight - Φ) /e
Q: A father and his daughter are interested in the same baseball game. The father sits next to his…
A: We have to determine weather the daughter or the Father hears the home run first.
Q: The figure shows an iron ball suspended by thread of negligible mass from an upright cylinder that…
A: We are given system which comprises of cylinder and ball. We first find the total weight of the…
Q: A converging lens (f = 10 cm) and a second converging lens (f = 30 cm) are placed 25 cm apart, and…
A: To find : location of final image
Q: Q.12: Four resistances arranged to form a Whetstone's network are 80, 120, 60 and 272. The…
A: We need to compute-Resistance (R)=?The data given as-Wheatstone's networkR1=8 ohmR2=12 ohmR3=6…
Q: Newton's Law of Cooling The temperature, u, of a heated object at a given time t can be modeled by…
A: We are given initial temperature of object. We are also given temperature of surroundings. The…
Q: A car is traveling due west at 20.0 m/s. Find the velocity of the car after 3.00 s if its…
A: Given: In this question, the details are, A car is traveling due west at u=20.0 m/s. To find the…
Q: Two identical positive point charges q are placed on the axis at x = -a and x = +a, as shown in Fig.…
A:
Q: 4) Calculate the energy in terms of KT and Ef at which the difference between the Boltzmann and…
A: Ghjjjhdhdhdhdjddhdghhhragsvbbggjcjfgggfnxnxbxhxggfghhfvggghjfghgh
Q: Consider a quantum system with three states and a Hamiltonian given by 1 2ε 0 Ĥ = H₂ 2ε 1 3ε 0 3ε 4…
A: For finding the eigenvalues and eigenvectors of the Hamiltonian we use the determinant of the…
Q: Show that (†) ¹ = Â.
A:
Q: 1. A 20 kg mass hanging from a spring stretches the spring by 0.06 m. A.)What is the value of the…
A:
Q: Choose the description from A through D which best describes the illustrated wave packet.
A: Wavelength (λ): The wavelength of light is defined as “The distance between the two successive…
Q: Q3: use the method of Lagrange undetermined multipliers to find the acceleration of the system shown…
A: Lagrangian mechanics is a form of classical mechanics that was developed in physics and is based on…
Q: Two bodies of mass m₁ and m₂ hang downwards, attached by massless springs of Hooke's constant k…
A: Given:mass of object attached to lower spring, m2body 1 is held at equilibrium position, hence, x1 =…
Q: When current flows through a wire protons are moving opposite the direction of the current. protons…
A: The current flow in a conductor is made up of many free electrons, which make up the conductor.These…
Q: An 8.0 g ice cube at -10°C is put into a Thermos flask containing 100 cm³ of water at 20°C. (a) What…
A: Given: m=8g T=-10 deg C V=100 T_w=20 deg C
Q: Why does the parasite drag (Not rolling friction) increase on the takeoff roll? Group of answer…
A: Why does the parasite drag increase on the takeoff roll.
Q: A uniform magnetic field makes an angle of 60° with the central axis of a circular coil of 100 turns…
A:
Q: A parallel RLC circuit has the following component: R = 100 0, L = 0.1 H, and C= 10 µF. The…
A:
Q: Consider three charges 91, 91 and 93, each equal to q, at the vertices of an equilateral triangle of…
A:
Q: Two coils are placed close to each other and have a mutual inductance of 150 µH. The current through…
A: Inductors store energy as magnetic fields. Thus when a secondary inductor is placed near an inductor…
Q: Let Z₁, Z2, Z3 be three complex numbers and a, b, c be real numbers not all zero, such that a + b +…
A: Given Data : Z1 , Z2 , Z3 are complex numbers a, b, c be real numbers not all zero a+b+c=0 az₁ +…
Q: opt
A: Given: Gravitational acceleration is 16 m/s2
Q: Which of the following is the correct increasing order of the speed of the color components of the…
A: As we know that the velocity (v) of light is the product of frequency (f) and wavelength (λ) of the…
Q: A body moving along a straight line at 20 m/s decelerates at the rate of 4 m/s2. After 2 seconds its…
A: Given data, Initial velocity u = 20 m/sec. Deacceleration is given a=-4 m/s2. Time is given t = 2…
Q: 00100 POST10-$+27-20-17045 Kaguravu Mjamd 20 pel Apand came at you comente en jaqi.comS
A:
Q: could you also do d e and f?
A: Given := mass 0.593 kg amplitude 26 cm T=0.418s ω=15.02 rad/s
Q: The figure shows an iron ball suspended by thread of negligible mass from an upright cylinder that…
A:
Q: Consider a simplified classical physics scenario of a hydrogen atom where the electron orbits the…
A: The magnetic moment is the strength of the magnet to produce the magnetic field.
Q: A particle of mass m carrying a charge -1 starts moving around a fixed charge +92 along a circular…
A:
Q: Let's consider the two-qubit state |V) = 100) + i³|01) + 110). a) Find the expectation values for…
A: The qubit state gave the information about quantum in the form of a binary bit, it gives the…
Q: At a particular instant of time, a light beam traveling in the positive z direction has an electric…
A: We must determine whether the magnetic field in the beam has a positive, negative, or zero z…
Q: The position of a particle moving along the x axis is given by x(t) =6t^2 -t^3, where x is in meters…
A: Given: In this question, the given details are, The position of a particle moving along the x axis…
Q: In an electric shaver, the blade moves back and forth over a distance of 1.8 mm in simple harmonic…
A: We are given the the distance between the maximum amplitude and minimum amplitude. We know that…
Q: SSM Figure 29-87 shows a cross section of a hollow cylindrical conductor of radii a and b, carrying…
A: Step 1: Given: In the figure of hollow cylindrical conductor a is the radius of the outer…
Q: A 200 resistor, a 0.850 H inductor, and a 5.00 μF capacitor are connected in series across a voltage…
A:
Q: A fairground ride spins its occupants inside a flying saucer-shaped container. If the horizontal…
A: Given: In this question, the given details are, A fairground ride spins its occupants inside a…
Q: Point charges are placed at the vertices of a square of side a as shown in Fig. What should be sign…
A:
Q: Calculate the temperature that allows the stimulated emission rate to exceed the spontaneous…
A:
Q: Below is a graph of a potential, V(x), for some quantum mechanical system. Note that V(x) = ∞ for x…
A: We are given a quantum mechanical system. We are given step potential at each point. The potential…
Q: The expectation value of a function f(x), denoted by (f(x)), is given by (f(x)) = f(x)\(x)|³dx +00…
A: Cghjj1ggggftgggggfffgggghhhhttyyhccggvhbhggvcghhh

Step by step
Solved in 2 steps with 2 images
