

Q: Graph the function. y = 2(;)* O A. ty 10 1 O B. y 4 2 10 1 6 Review progress Question
A:
Q: Here is a graph representing a function of the form f(x) = a. b. Find the values of a and b. Show…
A:
Q: Determine whether each table represents a linear or nonlinear function. Explain. (Examples 1 and 2)…
A: This represents a linear function. The function is, x = 2y
Q: The table shows a function. Is the function linear or nonlinear? y -10 10 3. 3 -7 -10 linear…
A: Given table is: x y -10 10 335 -7 6 -10
Q: The table shows a function. Is the function linear or nonlinear? 8 3 6 10 2 linear nonlinear
A: Linear function exist in the case has two variables only. If it has more than two variables, it is…
Q: Write the function whose graph is the graph of y = x +1, but is reflected about the y-axis. y =…
A: The given function, y=x+1
Q: Which mapping diagram models a relationship that is NOT a function? Explain how you found your…
A: OPTION (A) is not a function, there is more than one output for a given input. For the input 2 there…
Q: Can the table shown below represent values of a function? Explain. Input 10 20 30 40 50 (x) Output…
A: for function each input has only single output As per our guidelines we are supposed to answer…
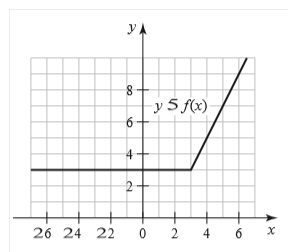
Q: Write a definition of the piecewise linear function y3f(x) that is given in the graph. -4- -2 Select…
A: Solve the following
Q: Write a short statement that expresses a possible function between the given variables. (weight of a…
A: Given variables are weight of a bag of grapes,price of the bag of grapes.
Q: Determine whether the equation defines y as a function of x. (See Example 9.) 2 + (y – 9)2 = 5 is a…
A:
Q: the dialog box provided, answer the following question. Is this a function? 7 8 1 4 5 Why? 43 2.
A: Given query is to find that , data is a function nor not.
Q: Exercise 3: You challenge yourself and graph the given functions on your own 1. y= 2) -3 -2 -1 1. 3.
A: We have to find the graph
Q: Use the information given to answer the question. Consider the graph of the function f(x). Y 10 -8…
A: This is a problem related to linear transformation of the graph. Based on the general formula we…
Q: Here is a graph representing a function of the form f(x) = a•b* . Find the values of a and b. Show…
A:
Q: Decide whether the graph shown below is a function or not. 7 51 -5 10 -5 A yes, it is a function no,…
A: A function can be defined as a relation between a set of inputs where each input has exactly one…
Q: Can the table shown below represent values of a function? Explain. Input (x) 0.5 7 7. 12 15 Output…
A: We have to explain that the given table represents the values of a function or not.
Q: Which mapping diagram does not represent a function? 26 37 4 8 A) 26 B) 2 6 37 2- D) 3. 48
A: To find the mapping diagram which doesn't represent a function
Q: The table shows a function. Is the function linear or nonlinear? y 7 5 1/2 1/2 4) 1/2
A: If you like the solution then please give it a thumbs up.... The Answer is: Result :…
Q: Which of the following is the rule for the piece-wise function shown below? 10 8- 6- 2 10 -8 -4-2 2…
A: We can solve this as follows:
Q: Suppose you have a $235 gift card for gas, and you average $24 per week in gas. a) What type of…
A: Given:- total gift cards for gas = 235 average per week in gas = 24 a. here , linear model is the…
Q: Write a function to model the scenario [y=a (x-h)2 + k]
A: We will find out the required function.
Q: The table shows a function. Is the function linear or nonlinear? y 6- -72 4 -7 6. 9 linear nonlinear…
A: If the rate of change in a function is constant, then it is a linear function. Rate of change=dydx
Q: Which of the following is the widest domain of function? A) (0, ∞) B) R - {0} C) (-∞, 0) D)…
A: Given that f(x) = √x Here we have to find the widest domain of this function.
Q: The table shows a function. Is the function linear or nonlinear? -22 8 6. 9- -4 1. 1/2 1/2
A:
Q: The table shows a function. Is the function linear or nonlinear? y _1 -32 2 10 52 linear nonlinear…
A: Solution of this question is
Q: 13. The table shows what it costs to rent a bicycle for up to 8 hours. Write a function to represent…
A:
Q: What function is graphed below? 14 13 10 9. -2
A:
Q: Vhich table could represent a function? f(x) h(x) 4 6 4 1 6. 6. 2 2 g(x) k(x) 3. 2. 4. 23 2. 1.
A: Definition of the function: A function is the relation between x and y where y is the output value…
Q: Write a rule for the graph of the function. Answers may vary. y= f(x) 4-3-2-1 3 4 5
A:
Q: The table of a linear function is partially completed below. What is the missing y-value to complete…
A: From the given table ,we get
Q: 26 Caleb claims that the ordered pairs shown in the table below are from a nonlinear function. xf(x)…
A: Given that the ordered pairs of values of x and f(x). The difference between x and f(x) is given…
Q: 8. Consider a linear graph that goes through the origin. Is the function represented by this graph…
A: 8) Given that a graph that passes through the origin. We need to determine whether the function…
Q: 3 43 -2
A:
Q: Does the table represent a linear or nonlinear function? X0 1 2 3. y 28 19 12 7 O inear O nonlinear
A: Explanation of the solution is given below...
Q: The table shows a function. Is the function linear or nonlinear? y 6- -7 -42 -81 -9 linear nonlinear…
A: The answer is given below: The given function is Non-linear Explanation is given in the next step
Q: Area (in^2), A Radius (inches), r 12.57 4. 50.27 113.10 8 201.06 10 314.16
A: This is an example of non linear function. There are many points that can differentiate between…
Q: Write an equation for the function that is described by the following characteristics. The shape…
A: The function is given by,
Q: Does the table represent a linear or nonlinear function? x 0 2 4 6. y-1-1 7 23 O inear o nonlinear
A: We know Linear functions are those whose graph is a straight line. A linear function has the…
Q: 4. Can the table shown below represent values of a function? Explain. Input (x) 10 20 50 75 90…
A: Given table is
Q: Which statement best explains whether or not the table shown represents a function?A.The table…
A:
Q: 8. Which diagram shows a relation that is not a function? A. В. D. C.
A: This question is based on function and relation all three option grapgh represent a function of…
Q: Suppose you have a $155 gift card for gas, and you average $17 per week in gas. a) What type of…
A:
Q: (22,4) (35,4) 4 (T1|2) 2 10 20 30 40 Age E.
A: We have to create a piecewise function from given figure
Q: Write a function rule for the table. Days Cost to Rent a Truck 1 34 2 57 3 80 4 103
A: In the question we have to write the function from given table.
Q: Which relation does NOT represent a function? 1) 2) 2 8 14 3) 15 天: 17 19 A 00 12 VA
A:
Q: The table shows a function. Is the function linear or nonlinear? y 7. 4 10 6. 1/3 2.
A:
Q: Where is the function discontinuous? 6- 4 3- 2- 1 -10 -9 -11 3- 4- 12 m4
A:
Q: Suppose you have a $205 gift card for gas, and you average $18 per week in gas. a) What type of…
A:
Q: 1. Circle the letter next to the graph if it represents a linear function. A y B C D E F y 10
A: Definition of the linear function by graphical approach: The linear function is the function whose…
Write a definition of the function whose graph is given.

Given graph:

Step by step
Solved in 2 steps with 1 images


