Uncertainty Average Height y (m) Transit time Transit time Transit time Average t2 (s) ti (s) t3 (s) transit time U (s) transt time (s) squared (s2) 1 0.938 0.4506 0.4514 0.4464 0.846 0.4268 0.4278 0.4311 3 0.735 0.3935 0.4087 0.3959 4 0.631 0.3704 0.3755 0.3696 0.520 0.3363 0.3357 0.3356 (a) On the graph paper provided draw a graph of height y (on y axes) versus average transit time squared (on x axes). Chonse an appropriate scale on both axes to use at least 75% of the graph paper. (b) Draw the best fit line (line in between data point without hitting any data point) and find the slope of the best fit line. To calculate slope you have to choose two additional points that lie on the best fit line ("slope points"), do not use data points. Clearly mark your slope points and their coordinates and show on the graph your calculation to get credit. line, slope points) slope of the best fit line (write unit: %3D 2.
Uncertainty Average Height y (m) Transit time Transit time Transit time Average t2 (s) ti (s) t3 (s) transit time U (s) transt time (s) squared (s2) 1 0.938 0.4506 0.4514 0.4464 0.846 0.4268 0.4278 0.4311 3 0.735 0.3935 0.4087 0.3959 4 0.631 0.3704 0.3755 0.3696 0.520 0.3363 0.3357 0.3356 (a) On the graph paper provided draw a graph of height y (on y axes) versus average transit time squared (on x axes). Chonse an appropriate scale on both axes to use at least 75% of the graph paper. (b) Draw the best fit line (line in between data point without hitting any data point) and find the slope of the best fit line. To calculate slope you have to choose two additional points that lie on the best fit line ("slope points"), do not use data points. Clearly mark your slope points and their coordinates and show on the graph your calculation to get credit. line, slope points) slope of the best fit line (write unit: %3D 2.

Related questions
Question
100%
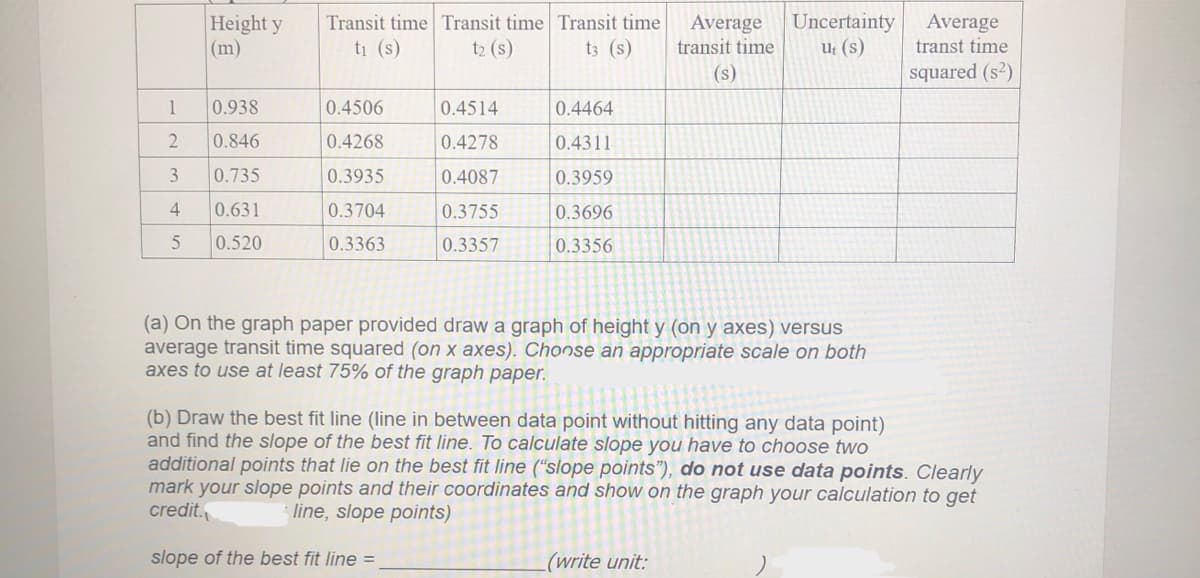
Transcribed Image Text:Height y
(m)
Uncertainty
Ut (s)
Average
transt time
Transit time Transit time Transit time
Average
transit time
ti (s)
t2 (s)
t3 (s)
(s)
squared (s?)
1
0.938
0.4506
0.4514
0.4464
0.846
0.4268
0.4278
0.4311
3
0.735
0.3935
0.4087
0.3959
4
0.631
0.3704
0.3755
0.3696
0.520
0.3363
0.3357
0.3356
(a) On the graph paper provided draw a graph of height y (on y axes) versus
average transit time squared (on x axes). Chonse an appropriate scale on both
axes to use at least 75% of the graph paper.
(b) Draw the best fit line (line in between data point without hitting any data point)
and find the slope of the best fit line. To calculate slope you have to choose two
additional points that lie on the best fit line ("slope points"), do not use data points. Clearly
mark your slope points and their coordinates and show on the graph your calculation to get
credit.
line, slope points)
slope of the best fit line =
(write unit:
Expert Solution
This question has been solved!
Explore an expertly crafted, step-by-step solution for a thorough understanding of key concepts.

This is a popular solution!

Trending now
This is a popular solution!

Step by step
Solved in 2 steps with 2 images
