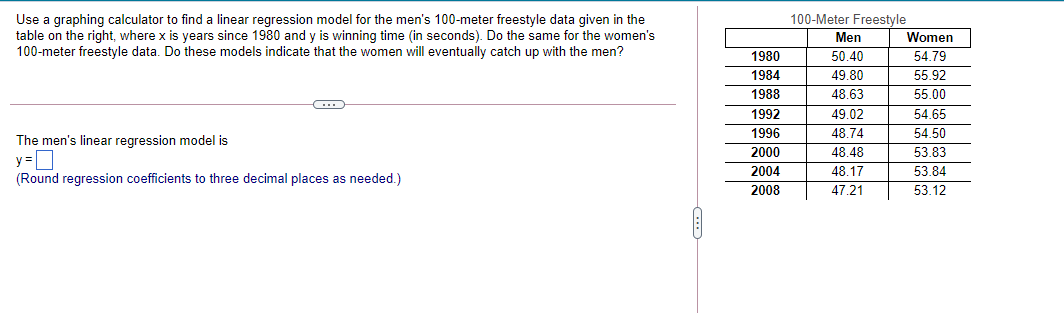
Use a graphing calculator to find a linear regression model for the men's 100-meter freestyle data given in the table on the right, where x is years since 1980 and y is winning time (in seconds). Do the same for the women's 100-meter freestyle data. Do these models indicate that the women will eventually catch up with the men? 100-Meter Freestyle Men Women 1980 50.40 54.79 1984 49.80 55.92 1988 48.63 55.00 1992 49.02 54.65 1996 48.74 54.50 The men's linear regression model is y =D (Round regression coefficients to three decimal places as needed.) 2000 48.48 53.83 2004 48.17 53.84 2008 47.21 53.12
Use a graphing calculator to find a linear regression model for the men's 100-meter freestyle data given in the table on the right, where x is years since 1980 and y is winning time (in seconds). Do the same for the women's 100-meter freestyle data. Do these models indicate that the women will eventually catch up with the men? 100-Meter Freestyle Men Women 1980 50.40 54.79 1984 49.80 55.92 1988 48.63 55.00 1992 49.02 54.65 1996 48.74 54.50 The men's linear regression model is y =D (Round regression coefficients to three decimal places as needed.) 2000 48.48 53.83 2004 48.17 53.84 2008 47.21 53.12

Functions and Change: A Modeling Approach to College Algebra (MindTap Course List)
6th Edition
ISBN:9781337111348
Author:Bruce Crauder, Benny Evans, Alan Noell
Publisher:Bruce Crauder, Benny Evans, Alan Noell
Chapter3: Straight Lines And Linear Functions
Section3.CR: Chapter Review Exercises
Problem 16CR: XYZ Corporation Stock Prices The following table shows the average stock price, in dollars, of XYZ...

Related questions
Question
Question is in the image below thanks appreciate it
Transcribed Image Text:100-Meter Freestyle
Use a graphing calculator to find a linear regression model for the men's 100-meter freestyle data given in the
table on the right, where x is years since 1980 and y is winning time (in seconds). Do the same for the women's
100-meter freestyle data. Do these models indicate that the women will eventually catch up with the men?
Men
Women
1980
50.40
54.79
1984
49.80
55.92
1988
48.63
55.00
1992
49.02
54.65
1996
48.74
54.50
The men's linear regression model is
2000
48.48
53.83
y =
2004
48.17
53.84
(Round regression coefficients to three decimal places as needed.)
2008
47.21
53.12
Expert Solution
This question has been solved!
Explore an expertly crafted, step-by-step solution for a thorough understanding of key concepts.

This is a popular solution!

Trending now
This is a popular solution!

Step by step
Solved in 3 steps with 2 images

Recommended textbooks for you
Functions and Change: A Modeling Approach to Coll…
Algebra
ISBN:
9781337111348
Author:
Bruce Crauder, Benny Evans, Alan Noell
Publisher:
Cengage Learning

Elementary Linear Algebra (MindTap Course List)
Algebra
ISBN:
9781305658004
Author:
Ron Larson
Publisher:
Cengage Learning

Algebra and Trigonometry (MindTap Course List)
Algebra
ISBN:
9781305071742
Author:
James Stewart, Lothar Redlin, Saleem Watson
Publisher:
Cengage Learning
Functions and Change: A Modeling Approach to Coll…
Algebra
ISBN:
9781337111348
Author:
Bruce Crauder, Benny Evans, Alan Noell
Publisher:
Cengage Learning
Elementary Linear Algebra (MindTap Course List)
Algebra
ISBN:
9781305658004
Author:
Ron Larson
Publisher:
Cengage Learning
Algebra and Trigonometry (MindTap Course List)
Algebra
ISBN:
9781305071742
Author:
James Stewart, Lothar Redlin, Saleem Watson
Publisher:
Cengage Learning

Glencoe Algebra 1, Student Edition, 9780079039897…
Algebra
ISBN:
9780079039897
Author:
Carter
Publisher:
McGraw Hill

College Algebra
Algebra
ISBN:
9781305115545
Author:
James Stewart, Lothar Redlin, Saleem Watson
Publisher:
Cengage Learning

Algebra & Trigonometry with Analytic Geometry
Algebra
ISBN:
9781133382119
Author:
Swokowski
Publisher:
Cengage