Use a software program or a graphing utili

Elementary Linear Algebra (MindTap Course List)
8th Edition
ISBN:9781305658004
Author:Ron Larson
Publisher:Ron Larson
Chapter5: Inner Product Spaces
Section5.CM: Cumulative Review
Problem 13CM

Related questions
Question
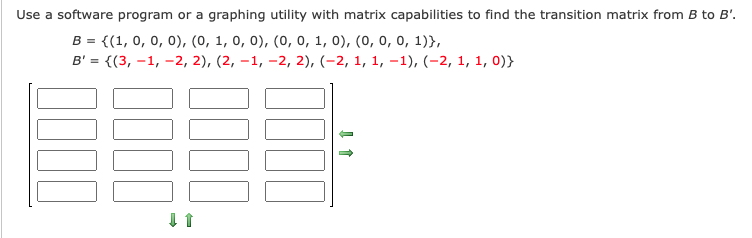
Transcribed Image Text:Use a software program or a graphing utility with matrix capabilities to find the transition matrix from B to B'.
B = {(1, 0, 0, 0), (0, 1, 0, 0), (0, o, 1, 0), (0, 0, 0, 1)},
В'%3D { (3, —1, —2, 2), (2, -1, -2, 2), (-2, 1, 1, -1), (-2, 1, 1, 0)}
Expert Solution
This question has been solved!
Explore an expertly crafted, step-by-step solution for a thorough understanding of key concepts.

Step by step
Solved in 2 steps

Recommended textbooks for you
Elementary Linear Algebra (MindTap Course List)
Algebra
ISBN:
9781305658004
Author:
Ron Larson
Publisher:
Cengage Learning

Linear Algebra: A Modern Introduction
Algebra
ISBN:
9781285463247
Author:
David Poole
Publisher:
Cengage Learning
Elementary Linear Algebra (MindTap Course List)
Algebra
ISBN:
9781305658004
Author:
Ron Larson
Publisher:
Cengage Learning
Linear Algebra: A Modern Introduction
Algebra
ISBN:
9781285463247
Author:
David Poole
Publisher:
Cengage Learning