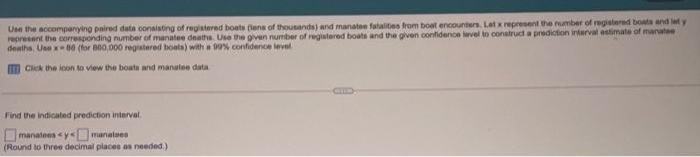
Use the accompanying paired data consisting of registered boats (lena of thousands) and manatee fatalites rom boat encounters. Letxepresent the number of registered boats and let y represerd the coresponding number of manatee deathe. Use the given number of registered boats and the given confidence level to oonstruct a prediction interval estimate of manate deaths. Use 00 (for B00.000 registered boats) with a 90% confidence level Click the lon to view the boate and manatee data
Use the accompanying paired data consisting of registered boats (lena of thousands) and manatee fatalites rom boat encounters. Letxepresent the number of registered boats and let y represerd the coresponding number of manatee deathe. Use the given number of registered boats and the given confidence level to oonstruct a prediction interval estimate of manate deaths. Use 00 (for B00.000 registered boats) with a 90% confidence level Click the lon to view the boate and manatee data

Chapter9: Sequences, Probability And Counting Theory
Section9.5: Counting Principles
Problem 43SE: A wholesale T-shirt company oilers sizes small, medium, large, and extra-large in organic or non-...

Related questions
Question
Please please help me.
Don't reject it.
It's an urgent.
I will really really upvote.
The value under cursor is 87.
Thanks
Transcribed Image Text:Use the accompanying paired data consisting of registered boats (lens of thousands) and manatee fatalities from boat encounters. Lat x represent the rumber of registered boats and let y
represent the corresponding number of manatee deathe. Use the given number of registered boats and the given confidence level to construct a prediction interval estimate of manatee
deaths, Use 00 (for B00,000 registered boats) with a 99% confidence level
Click the loon to view the boate wnd manatee data
Find the indicated prediction interval.
manatees <y manatees
(Round to three decimal places as needed)
Transcribed Image Text:iste
ath
th a
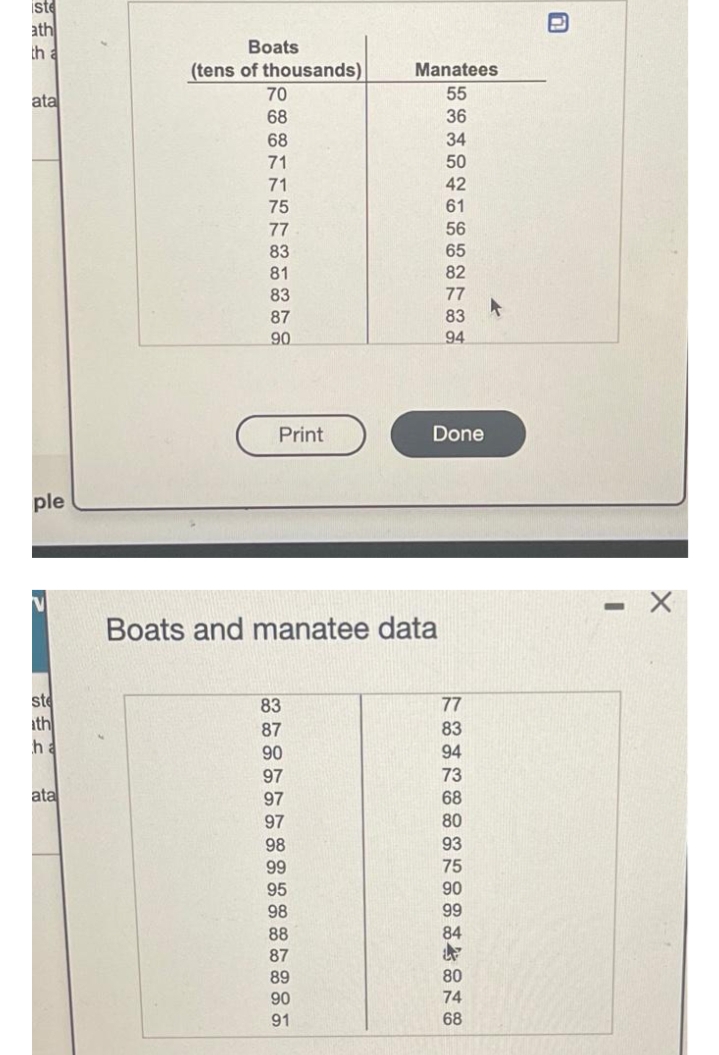
Boats
(tens of thousands)
Manatees
70
55
ata
68
36
68
34
71
50
71
42
75
61
77
56
83
65
81
82
83
77
87
83
90
94
Print
Done
ple
Boats and manatee data
ste
ith
ha
83
77
87
83
90
94
97
73
ata
97
68
97
80
98
93
99
75
95
90
98
99
88
84
87
89
80
90
74
91
68
Expert Solution
This question has been solved!
Explore an expertly crafted, step-by-step solution for a thorough understanding of key concepts.

This is a popular solution!

Trending now
This is a popular solution!

Step by step
Solved in 2 steps

Recommended textbooks for you