Use the following graph to illustrate the relationship between the cost per bag of potato chips and the quantity of potato chips produced if it has a minimum point at $4 a bag and 4 bags. Put a point to show the minimum point Screenshot attached below thanks just graph what the question is asking
Use the following graph to illustrate the relationship between the cost per bag of potato chips and the quantity of potato chips produced if it has a minimum point at $4 a bag and 4 bags. Put a point to show the minimum point Screenshot attached below thanks just graph what the question is asking

Algebra & Trigonometry with Analytic Geometry
13th Edition
ISBN:9781133382119
Author:Swokowski
Publisher:Swokowski
Chapter3: Functions And Graphs
Section3.5: Graphs Of Functions
Problem 28E

Related questions
Question
Use the following graph to illustrate the relationship between the cost per bag of potato chips and the quantity of potato chips produced if it has a minimum point at $4 a bag and 4 bags. Put a point to show the minimum point
Screenshot attached below thanks
just graph what the question is asking
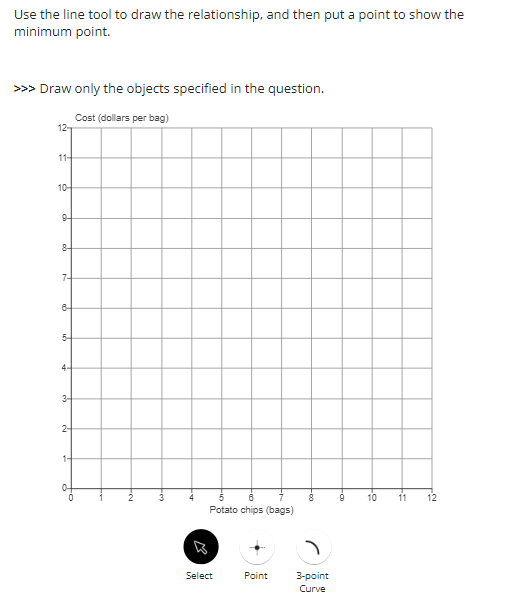
Transcribed Image Text:Use the line tool to draw the relationship, and then put a point to show the
minimum point.
>>> Draw only the objects specified in the question.
Cost (dollars per bag)
12-
11-
10-
9-
8-
7-
6-
5-
4-
3-
2-
1-
P
0
FN
Potato chips (bags)
Select
Point
3-point
Curve
10
11
12
Expert Solution
This question has been solved!
Explore an expertly crafted, step-by-step solution for a thorough understanding of key concepts.

This is a popular solution!

Trending now
This is a popular solution!

Step by step
Solved in 2 steps with 2 images

Recommended textbooks for you
Algebra & Trigonometry with Analytic Geometry
Algebra
ISBN:
9781133382119
Author:
Swokowski
Publisher:
Cengage
Algebra & Trigonometry with Analytic Geometry
Algebra
ISBN:
9781133382119
Author:
Swokowski
Publisher:
Cengage