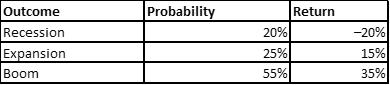
Use the following information to answer the question. Based on above data, determine the expected return? Select one: a. 12.06% b. 19% c. 17.35% d. 16.72%


Q: Calculate : M-squared measure T-squared measure, and Appraisal ratio (information ratio) Fund…
A: M-squared measure = Sharpe ratio*SDmarket + Risk free rate T-square = (Treynor ratio)2 Appraisal…
Q: Read the z statistic from the normal distribution table and choose the correct answer. For a…
A:
Q: 4. Given the probability and returns associated with each state, what is the expected return? What…
A: Calculations of expected return and standard deviation: Excel workings:
Q: Ahsan, an individual investor, is evaluating the investment opportunity. To evaluate this in…
A: Expected rate is the average rate of return considering the the probability of the return. Expected…
Q: If two returns are positively related to each other, they will have a ________, and if they are…
A: Covariance: calculates the directional relationship between two variables.
Q: Assume that there is a positive linear correlation between the variable R (return rate in percent of…
A: Positive linear correlation:- It is the relationship between two variables where an increase in the…
Q: a. Using the data in the table below alculate the following performance measures. i. Sharpe ratio…
A: Hi There, thanks for posting the question. But as per Q&A guidelines, we must answer the first…
Q: 3 The historical returns for two investments-A and B-are summarized in the following table for the…
A: Risky security is a security that has returns more volatile than the market and its return…
Q: calculate the standard deviation of returns.
A: Standard Deviation is the square root of the variance, which is the measurement of risk. And risk…
Q: Match each term with the best definition or descriptor. NPV is __________ ( a unitless ratio, a…
A: Solution:- Net Present Value (NPV) means the net present value of cash inflows after the deduction…
Q: calculate the following M-squared measure T-squared measure, and Appraisal ratio (information…
A: Risky portfolio consist of risky financial assets that have the potential to provide higher returns…
Q: Which of the following statements are true? A. The lower the M-squared the better. B. The higher…
A: higher the sharpe ratio , the better the portfolio is. higher the treynor ratio, the better the…
Q: The value of a correlation is reported to be r = 0.25. How is this interpreted?
A: Correlation: In the financial and investing sectors, correlation is a statistic that indicates the…
Q: Consider the following data for a dependent variable y and two independent variables, x1 and x2. 30…
A: Regression analysis is the relationship between independent and dependent variables. Regression…
Q: Which method of forecasting is most widely used? a. Regression analysis. b. Exponential smoothing.…
A: Regression analysis method of forecasting is the most widely used method of forecasting....
Q: 32. An analyst calculated the excess kurtosis of information, we conclude that the distribution of…
A: When the value of excess kurtosis is negative then the distribution is called platykurtic. (Note…
Q: If the B/C ratio for three alternatives A B, and Care 2.8, 3.3 and 1.95 respectively, the best…
A: Benefit-Cost Ratio: The projects which have a B/C ratio greater than 1 are considered good projects…
Q: I'm struggling with the area "indicate how the internal rate of return is calculated using the…
A: Equation needed Present value FACTOR =1-(1+r)-n/r i=interest rate =internal rate of return n=6…
Q: Which one of the following statements regarding the coefficient of determination is NOT correct?
A: Coefficient of correlation is the measure which is used by the management of the company so that it…
Q: Probability Return 0.35 -2% 0.35 12% 0.3 18% Expected return is ______ ?
A: The table is: Probability Return 0.35 -2% 0.35 12% 0.3 18%
Q: Illustrate the calculation of the standard deviation of returns?
A: Standard deviation refers to a measure of variation or dispersion of a set of values. We can…
Q: D modified) rnatives have the following returns and standard deviations of returns. Returns:…
A: Co-efficient of Variance - This represent the propotionate risk. When both return and risk are…
Q: 9% b. 20% c. 26% d. 22
A: IRR is a rate at which present value of cash inflows is equal to present value of cashoutflows.
Q: How is the standard deviation of returns calculated?
A: Standard deviation is ascertained as follows: The mean worth is dictated by including all the…
Q: - Select your answer - What type of pattern exists in the data? - Select your answer b. Develop the…
A:
Q: Consider the following POPULATION of returns: 5%, -4%, -3%, and 12%. What is the standard deviation…
A: Returns 5% -4% -3% 12% 6.50%
Q: What was the amount that you originally invested if a 48% ROI results in a return of $24,756?
A: The rate of return that an investor is earning from a particular investment in a particular time…
Q: Consider the following payoff table that represents the profits earned for each alternative (A, B,…
A: Given that A,B and C are alternatives of profit earned and S1, S2 ,S3 are states of nature .…
Q: Given the following probability distribution, compute for Outcome Probability Expected Return 20%…
A: As information expected return is as follows: Probability Return Expected return A B C=A*B…
Q: Suppose that sending an analyst to an executive education program will raise the precision of the…
A: The incremental return expected out of the active management is represented as M2's expected value.…
Q: The regression line in a scatterplot is also known as a(n): O A. R-squared line. O B. high-low line.…
A: A regression line seems to be a line that is used to define how a set of data behaves. In other…
Q: EXERCISE 2 From the data below, find the following: [al expected return [b] Standard deviation [c]…
A: In the case of multiple sub-parts, as per the guidelines, only three subparts are allowed to be…
Q: Describe the Incremental B/C-Ratio Analysis?
A: Benefit cost analysis: Benefit cost analysis refers to analyzing the desirability of project where…
Q: The following information pertains to data that have been gathered in the process of estimating a…
A: Given information, Mean value of the dependent variable= 30 Mean value of the independent…
Q: calculate the following Sharpe Ratio (SP) Treynor Measure Jensen Measure M2 measure T2 measure…
A: Note: as per policy, we answer only 3 sub questions under same question. Please repost the…
Q: Calculate the average rate of return, and conclude your results with your comments about the ARR for…
A: Calculation of Accounting Rate of Return (ARR) Year Net Cash Flow 1st…
Q: In a survey, the planning value for the population proportion is p* = 0.25. How large a sample…
A: Therefore, E = Error P = Population E = 0.03p = 0.25Z value at 95% confidence interval = 1.96 Number…
Q: Calculate the geometric average for the following returns
A: Geometric Average: This average also known as compounded annual growth rate or weighted rate of…
Q: b-L. I the aipha threshold is 010, and the p-value on a t-test comparing one company's ROA to the…
A: Alpha threshold = 0.10 P-value = 0.11
Q: The following results were obtained in a decision problem where payoffs are profits: EVSI EVwithPI…
A: EVSI (Expected Value of sample information)= 612 EV with PI = 4300 Efficiency of Sample Information…
Q: Calculate the standard deviation for the following returns:
A: Standard Deviation: It is a measure of statistics measuring the dispersion relative to the mean.
Q: Which of the following indicates that two variables tend to move in the same direction? a.negative…
A: Negative covariance means that the returns move in opposite direction. So, Option a is incorrect.…
Q: The correlation of two variables will be Group of answer choices a. Between -1 and +1, inclusive b.…
A: The correlation coefficient is a statistical measure.
Q: Given the following probability distribution of returns: Probability Return 0.1 -15.0%…
A: Probability Return 0.1 -15.00% 0.25 0.00% 0.3 8.50% 0.25 12.00% 0.1 32.00%
Q: Here are the estimated ROE distributions for Firms A, B, and C: Probability 0.1 0.2 0.4…
A: Hello, you have posted multiple questions. As per our guidelines, I have solved the first question.…
Q: According to Wald's criterion, which investment is decided by looking at the profitability of three…
A: The wald's criterion is the maximin criterion of selecting the best suitable alternative from a…
Based on above data, determine the expected return?

Step by step
Solved in 3 steps with 2 images
