Use the given graph of y = f(x) to find the intervals on which f'(x) > 0, the intervals on which f'(x) <0, and the values of x for which f'(x) = 0. Sketch a possible graph of y = f'(x).
Use the given graph of y = f(x) to find the intervals on which f'(x) > 0, the intervals on which f'(x) <0, and the values of x for which f'(x) = 0. Sketch a possible graph of y = f'(x).

Algebra and Trigonometry (MindTap Course List)
4th Edition
ISBN:9781305071742
Author:James Stewart, Lothar Redlin, Saleem Watson
Publisher:James Stewart, Lothar Redlin, Saleem Watson
Chapter2: Functions
Section2.4: Average Rate Of Change Of A Function
Problem 4.2E: bThe average rate of change of the linear function f(x)=3x+5 between any two points is ________.

Related questions
Question
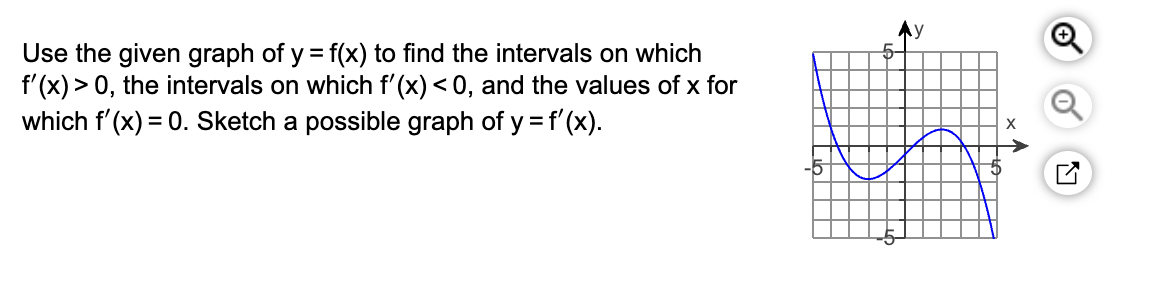
Transcribed Image Text:Use the given graph of y = f(x) to find the intervals on which
f'(x) > 0, the intervals on which f'(x) <0, and the values of x for
which f'(x) = 0. Sketch a possible graph of y = f'(x).
y
N
Expert Solution
This question has been solved!
Explore an expertly crafted, step-by-step solution for a thorough understanding of key concepts.

Step by step
Solved in 2 steps with 2 images

Follow-up Questions
Read through expert solutions to related follow-up questions below.
Follow-up Question
Need this answer idk what that is

Transcribed Image Text:Use the given graph of y = f(x) to find the intervals on which
f'(x) > 0, the intervals on which f'(x) <0, and the values of x for
which f'(x) = 0. Sketch a possible graph of y = f'(x).
On what subinterval(s) is f'(x) > 0? Select the correct choice below and, if necessary, fill in the answer box to complete
your choice.
A.
(Type your answer using interval notation. Use a comma to separate answers as needed.)
B. There are no such subintervals.
Solution
Recommended textbooks for you
Algebra and Trigonometry (MindTap Course List)
Algebra
ISBN:
9781305071742
Author:
James Stewart, Lothar Redlin, Saleem Watson
Publisher:
Cengage Learning
Algebra and Trigonometry (MindTap Course List)
Algebra
ISBN:
9781305071742
Author:
James Stewart, Lothar Redlin, Saleem Watson
Publisher:
Cengage Learning