
Chapter6: Exponential And Logarithmic Functions
Section6.8: Fitting Exponential Models To Data
Problem 45SE: For the following exercises, refer to Table 10. Use the intersect feature to find the value of x for...

Related questions
Topic Video
Question
please help with question 1
Transcribed Image Text:For 1 and 2
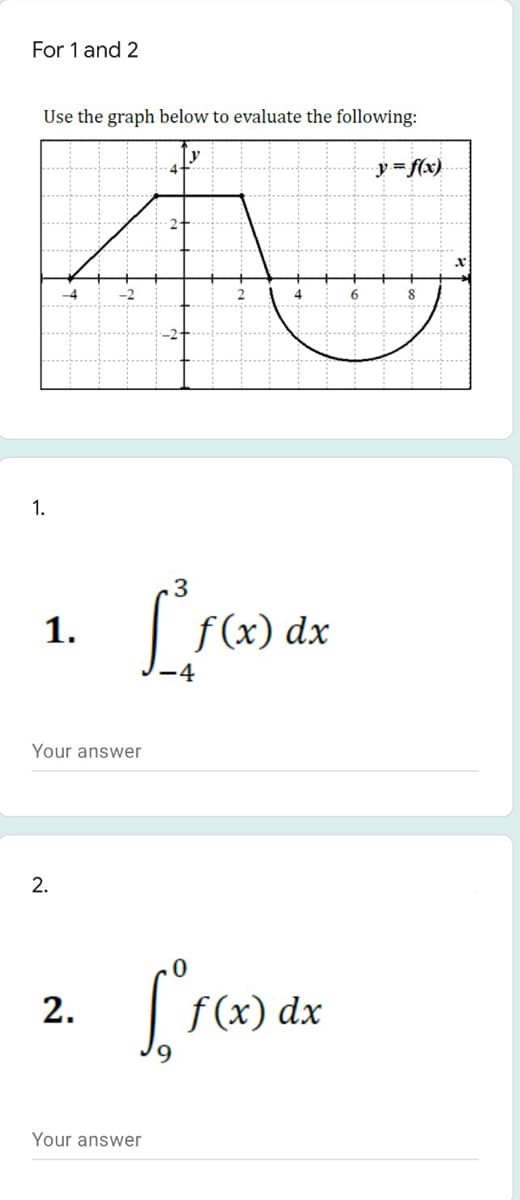
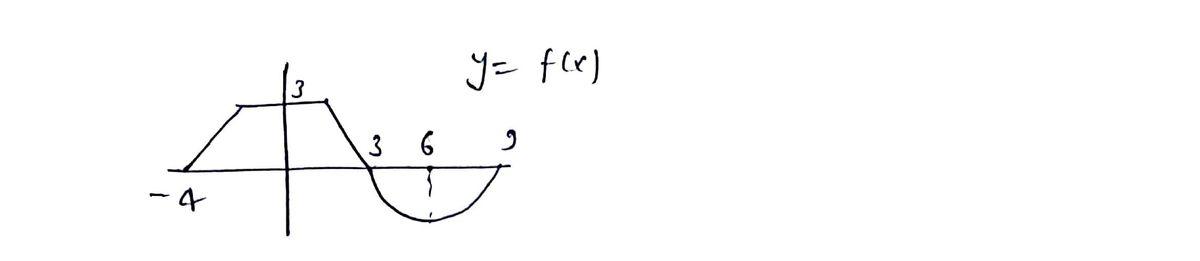
Use the graph below to evaluate the following:
y
y= f(x)
8
1.
3
1.
f (x) dx
-4
Your answer
2.
f (x) dx
9.
Your answer
2.
Expert Solution
Step 1

Trending now
This is a popular solution!

Step by step
Solved in 2 steps with 2 images

Knowledge Booster


Learn more about
Need a deep-dive on the concept behind this application? Look no further. Learn more about this topic, calculus and related others by exploring similar questions and additional content below.Recommended textbooks for you