- Use the graphs of = irection in which the curve is traced as t increases. = f(t) and y = g(t) to sketch the parametric curve (x(t), y(t)). Indicate with arrows the
- Use the graphs of = irection in which the curve is traced as t increases. = f(t) and y = g(t) to sketch the parametric curve (x(t), y(t)). Indicate with arrows the

Algebra & Trigonometry with Analytic Geometry
13th Edition
ISBN:9781133382119
Author:Swokowski
Publisher:Swokowski
Chapter11: Topics From Analytic Geometry
Section: Chapter Questions
Problem 20T

Related questions
Question
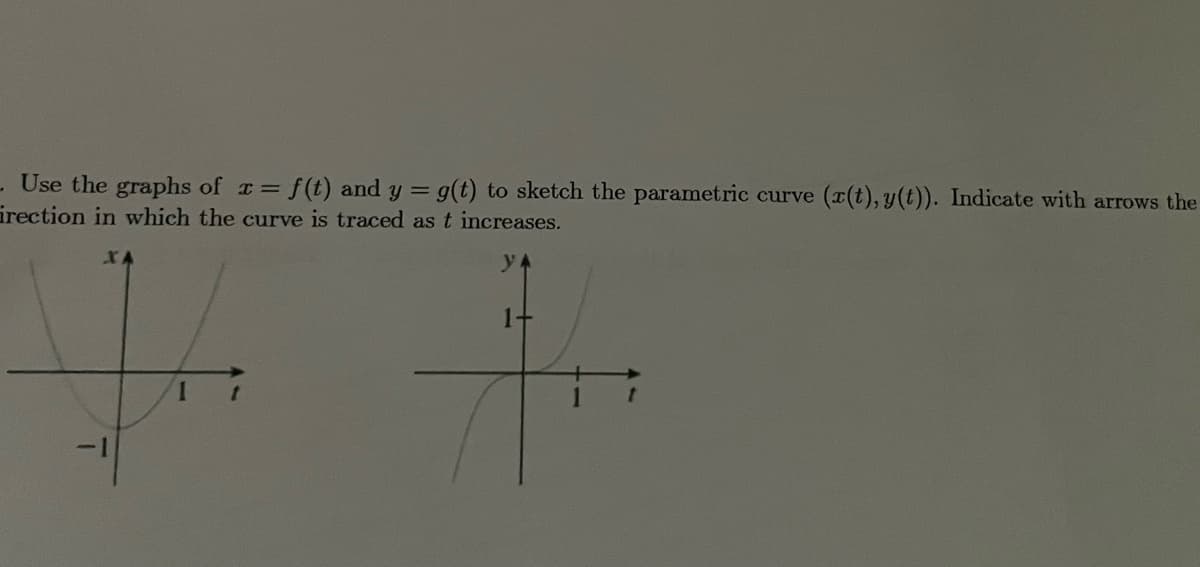
Transcribed Image Text:Use the graphs of
irection in which the curve is traced as t increases.
=f(t) and y = g(t) to sketch the parametric curve (x(t), y(t)). Indicate with arrows the
1-
-1
Expert Solution
This question has been solved!
Explore an expertly crafted, step-by-step solution for a thorough understanding of key concepts.

Step by step
Solved in 2 steps with 2 images

Recommended textbooks for you
Algebra & Trigonometry with Analytic Geometry
Algebra
ISBN:
9781133382119
Author:
Swokowski
Publisher:
Cengage
Algebra & Trigonometry with Analytic Geometry
Algebra
ISBN:
9781133382119
Author:
Swokowski
Publisher:
Cengage