Use the table of areas under the standard normal curve to find the probability that a z-score from the standard normal distribution will lie within the interval. (Round your answer to four decimal places.) z < 1.5
Use the table of areas under the standard normal curve to find the probability that a z-score from the standard normal distribution will lie within the interval. (Round your answer to four decimal places.) z < 1.5

A First Course in Probability (10th Edition)
10th Edition
ISBN:9780134753119
Author:Sheldon Ross
Publisher:Sheldon Ross
Chapter1: Combinatorial Analysis
Section: Chapter Questions
Problem 1.1P: a. How many different 7-place license plates are possible if the first 2 places are for letters and...

Related questions

Question
Use the table of areas under the standard normal curve to find the probability that a z-score from the standard
z < 1.5
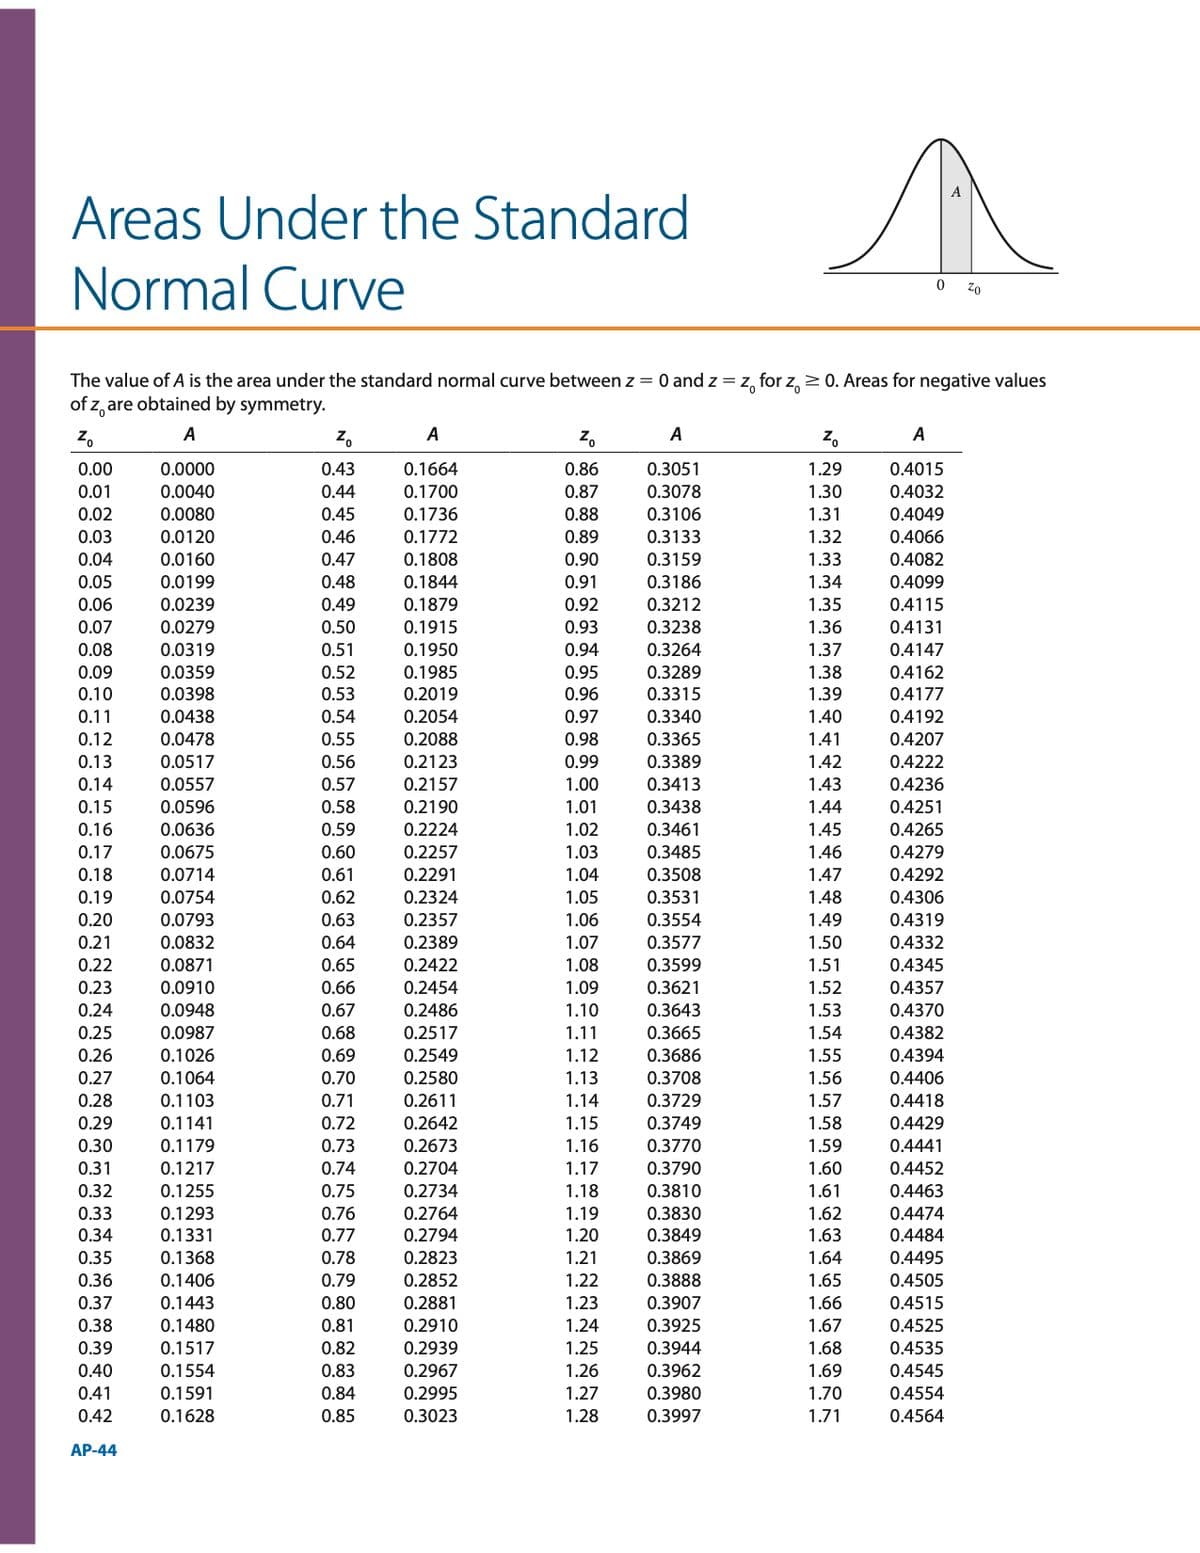
Transcribed Image Text:Areas Under the Standard
Normal Curve
0 Z0
The value of A is the area under the standard normal curve between z = 0 and z = z, for z, 2 0. Areas for negative values
of z, are obtained by symmetry.
z.
А
Z,
A
Z.
A
Z.
A
0.00
0.0000
0.43
0.1664
0.86
0.3051
1.29
0.4015
0.01
0.0040
0.44
0.1700
0.87
0.3078
1.30
0.4032
0.02
0.03
0.04
0.88
0.89
0.0080
0.45
0.1736
0.3106
1.31
0.4049
0.1772
0.1808
0.0120
0.46
0.3133
1.32
0.4066
0.0160
0.47
0.90
0.3159
1.33
0.4082
0.05
0.0199
0.48
0.1844
0.91
0.3186
1.34
0.4099
0.06
0.0239
0.49
0.1879
0.92
0.3212
1.35
0.4115
0.07
0.0279
0.50
0.1915
0.93
0.3238
1.36
0.4131
0.08
0.0319
0.51
0.1950
0.94
0.3264
1.37
0.4147
0.09
0.0359
0.52
0.1985
0.95
0.3289
1.38
0.4162
0.0398
0.0438
0.10
0.53
0.2019
0.96
0.3315
1.39
0.4177
0.11
0.54
0.2054
0.97
0.3340
1.40
0.4192
0.98
0.3365
0.4207
0.4222
0.12
0.0478
0.55
0.2088
1.41
0.13
0.0517
0.56
0.2123
0.99
0.3389
1.42
0.14
0.0557
0.57
0.2157
1.00
0.3413
1.43
0.4236
0.15
0.0596
0.58
0.2190
1.01
0.3438
1.44
0.4251
0.0636
0.0675
0.16
0.59
0.2224
1.02
0.3461
1.45
0.4265
1.46
1.47
1.48
1.49
0.17
0.60
0.2257
1.03
0.3485
0.4279
0.61
0.62
0.63
0.18
0.0714
0.2291
1.04
0.3508
0.4292
0.19
0.0754
0.2324
1.05
0.3531
0.4306
0.20
0.0793
0.2357
1.06
0.3554
0.4319
1.07
1.08
0.21
0.0832
0.64
0.2389
0.3577
1.50
0.4332
0.22
0.0871
0.65
0.2422
0.3599
1.51
0.4345
0.3621
1.52
1.53
0.23
0.0910
0.66
0.2454
1.09
0.4357
0.24
0.0948
0.67
0.2486
1.10
0.3643
0.4370
0.25
0.0987
0.68
0.2517
1.11
0.3665
1.54
0.4382
0.26
0.1026
0.69
0.2549
1.12
0.3686
1.55
0.4394
0.3708
1.56
1.57
0.27
0.1064
0.70
0.2580
1.13
0.4406
0.28
0.1103
0.71
0.2611
1.14
0.3729
0.4418
0.29
0.1141
0.72
0.2642
1.15
0.3749
1.58
0.4429
0.1179
0.1217
0.1255
0.1293
0.2673
1.59
0.4441
0.4452
0.4463
0.30
0.73
1.16
0.3770
0.3790
1.60
1.61
0.31
0.74
0.2704
1.17
0.32
0.75
0.2734
1.18
0.3810
0.33
0.76
0.2764
1.19
0.3830
1.62
0.4474
0.4484
0.4495
0.4505
0.4515
0.4525
0.4535
0.4545
0.34
0.1331
0.77
0.2794
1.20
0.3849
1.63
0.35
0.1368
0.78
0.2823
1.21
0.3869
1.64
0.36
0.1406
0.79
0.2852
1.22
0.3888
1.65
0.37
0.1443
0.80
0.2881
1.23
0.3907
1.66
0.38
0.1480
0.81
0.2910
1.24
0.3925
1.67
0.39
0.1517
0.82
0.2939
1.25
0.3944
1.68
0.40
0.1554
0.83
0.2967
1.26
0.3962
1.69
0.41
0.1591
0.84
0.2995
1.27
0.3980
1.70
0.4554
0.42
0.1628
0.85
0.3023
1.28
0.3997
1.71
0.4564
АР-44
Expert Solution
This question has been solved!
Explore an expertly crafted, step-by-step solution for a thorough understanding of key concepts.

This is a popular solution!

Trending now
This is a popular solution!

Step by step
Solved in 2 steps with 7 images

Knowledge Booster


Learn more about
Need a deep-dive on the concept behind this application? Look no further. Learn more about this topic, probability and related others by exploring similar questions and additional content below.Recommended textbooks for you
A First Course in Probability (10th Edition)
Probability
ISBN:
9780134753119
Author:
Sheldon Ross
Publisher:
PEARSON

A First Course in Probability (10th Edition)
Probability
ISBN:
9780134753119
Author:
Sheldon Ross
Publisher:
PEARSON