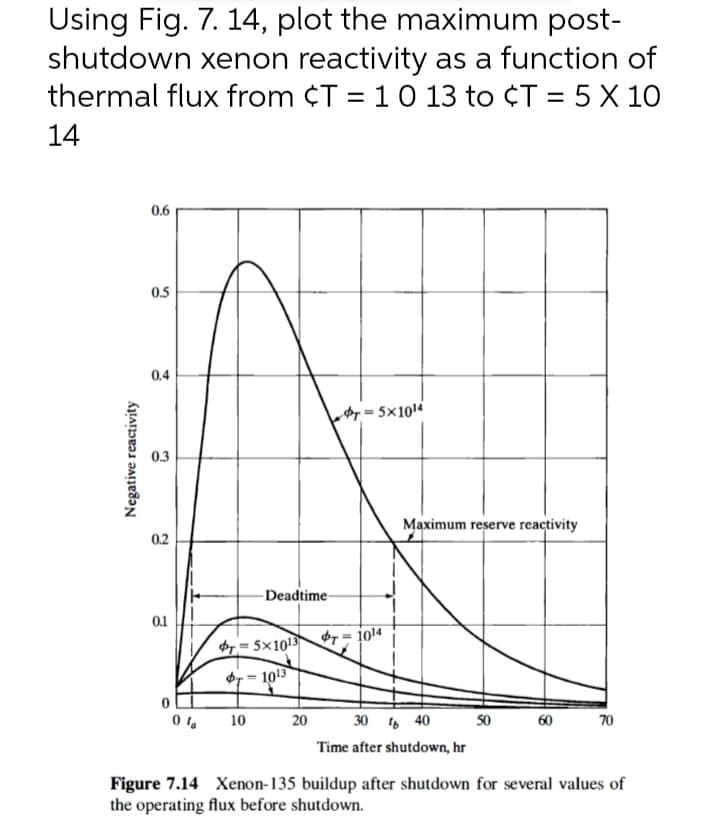
Using Fig. 7. 14, plot the maximum post- shutdown xenon reactivity as a function of thermal flux from ¢T = 1013 to ¢T = 5 X 10 14 0.6 0.5 0.4 dy =5x10¹⁴ 0.3 Maximum reserve reactivity 0.2 -Deadtime- 0.1 = 5x10 r = j014 d - 1013 10 20 30 , 40 SO 60 70 Time after shutdown, hr Figure 7.14 Xenon-135 buildup after shutdown for several values of the operating flux before shutdown. Negative reactivity
Using Fig. 7. 14, plot the maximum post- shutdown xenon reactivity as a function of thermal flux from ¢T = 1013 to ¢T = 5 X 10 14 0.6 0.5 0.4 dy =5x10¹⁴ 0.3 Maximum reserve reactivity 0.2 -Deadtime- 0.1 = 5x10 r = j014 d - 1013 10 20 30 , 40 SO 60 70 Time after shutdown, hr Figure 7.14 Xenon-135 buildup after shutdown for several values of the operating flux before shutdown. Negative reactivity

Related questions
Question
7
Transcribed Image Text:Using Fig. 7. 14, plot the maximum post-
shutdown xenon reactivity as a function of
thermal flux from ¢T = 10 13 to ¢T = 5 X 10
14
0.6
0.5
0.4
A = 5×10¹⁴
0.3
Maximum reserve reactivity
0.2
Deadtime-
0.1
= 5×10¹³ T = 1014
= 1013
10
20
30 , 40
50
60
70
Time after shutdown, hr
Figure 7.14 Xenon-135 buildup after shutdown for several values of
the operating flux before shutdown.
Negative reactivity
Expert Solution
This question has been solved!
Explore an expertly crafted, step-by-step solution for a thorough understanding of key concepts.

Step by step
Solved in 2 steps with 1 images
