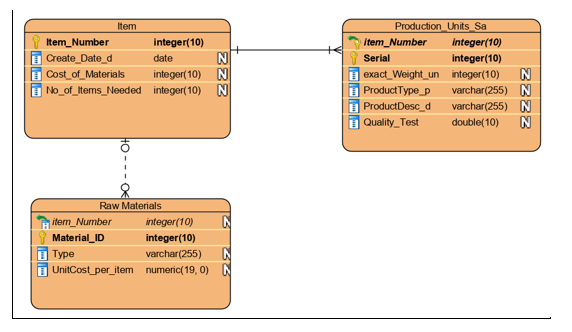
Using the ERD diagram above, identify an attribute that might represent a Derived Attribute. Once you identify, explain why this is so. Is this the only attribute? Are there others?


Q: Direction: Based on the given entities, make an Entity Relationship Diagram (ERD). Put attributes (…
A: Entity-relationship diagram(ER) is used to determine the relationship between two entities in a…
Q: In a few words, describe the logical relationship between the entities, attributes, and…
A: Introduction: An entity is a piece of data or a physical object. It is possible to save information…
Q: . Create a data model from the below and ensure it show: a.) Attributes b.) Entities c.)…
A: Summary :- We got our result.
Q: Let's say that in addition to being a component of the primary key, an attribute is also a candidate…
A: Given: What do you respond if someone suggests that an attribute which is a component of a composite…
Q: Analyze the given entity relationship diagram and answer the following questions. What is the…
A: Part(1) Degree of relationship is basically the number of entities that in general participates in…
Q: Describe the difference between simple attributes and composite attributes. Justify the need for…
A: INTRODUCTION: Here we need to tell the difference between simple attributes and composite attributes…
Q: Single-valued characteristics have one value, whereas multivalued attributes have many.
A: This classification is based on the attribute's ability to take multiple values. A multi-valued…
Q: Consider the E-R diagram for a university database as shown in Figure 1. What does deparment…
A: Entity In the Entity-Relationship diagram, department represents entity. An entity is an object in…
Q: Using the ERD diagram above, identify an attribute that might represent a Composite Attribute. Once…
A: In the ERD diagram above, Create_Date_d of type date can be represented as Composite Attribute.…
Q: An instructor has several phone numbers. When reducing the ER diagram down to a schema this must be…
A: Actually, ER is describes the structure of database with help of diagram.
Q: Q.Modify the ER diagram given below and add these make corrections if anything is wrong Weak entity…
A: In the given ER diagram The Attribute with underline is the key attribute that is the primary key…
Q: Given the information above, draw an EER Diagram showing the following: • Entities, • Attributes, •…
A: According to the given scenario, There are four entities Hospital, Patient, Doctor, and Records.…
Q: The code below demonstrates an important OOP characteristic. Describe this characteristic, then…
A: Given a piece of code, to determine the OOP characteristic shown.
Q: entity Attribute and primary key, also draw Entity diagram?
A: I have answered this question in step 2.
Q: What exactly are entity-relationship diagrams, and how do they come into play? What kind of symbol…
A: Any real-life item engaging in a business situation is represented by an entity, which contains a…
Q: The descriptive property possessed by each entity set is a(n): A Attribute. Instance. C Relation. D…
A: Answer A) Attribute
Q: Describe the entity-relationship model. How are entities, relationships, and attributes represented…
A: Actually, An Entity relationship diagram is a graphical representation a database that describes…
Q: Provide examples of how relationships are represented using attributes and the general term for an…
A: Introduction: Attributes are specifications that describe the properties of an object, element, or…
Q: Write down the many kinds of attributes in the Entity-Relationship (ER) model.
A: Given: 1. Make a list of the different kinds of characteristics that are used in the…
Q: lame the THREE (3) components that are considered to be part of any data Comment on the extent to…
A: Lets see the solution.
Q: difference between single-valued attributes and simple attributes
A: Difference between single-valued attributes and simple attributes A simple attribute refers to an…
Q: Interpret the different form of Entity used in the given scenario of ER diagram. Illustrate the…
A: Strong entity Account Region Item creep Weak Entity Character Item Instantiation creep…
Q: Draw a complete ER Diagram. Show all entities, attributes, primary keys, foreign keys,…
A:
Q: What is the attribute that could be obtained using other attributes in the Entity-Relationship…
A: Introduction: What is the attribute that could be obtained using other attributes in the…
Q: b) Draw the EER specialization diagram for the schema below Students (SID, Name, Address, Age)…
A: Enhanced Entity Relationship(EER) Model Specialization Specialization is a process that defines a…
Q: What are the applications of entity-relationship diagrams? What kind of symbol is used to depict a…
A: Answer : application of entity relationship diagram : It is to simply understanding the relationship…
Q: Examine the hierarchy for the university EER diagram (Figure 3-10). As a student, you are an…
A: Given: Examine the hierarchy for the university EER diagram (Figure 3-10). As a student, you are…
Q: Define the term attribute and give examples for the entity you described in question 4.7.
A: An attribute is a specification that defines a property of an object, element, or file. It may also…
Q: Modify the Er diagram given below and add these Weak entity Identifying relationship Weak…
A: ER Diagram using these Weak entity Identifying relationship Weak relationship Key attribute…
Q: Multiplicity is the same as what concept for an ERD? a. Relationship b. Attribute c. Entity d.…
A: Please see the next step for solution
Q: Subject: Database Identify ALL errors and correction on the entity relationship diagram (ERD) given…
A: The er diagram with a mistake is highlighted in figure 1 and correct er diagram is given below in…
Q: Illustrate an Entity-Relationship Diagram (ERD) model using Crow’s Foot notation Here we can have…
A:
Q: single instance of the entity? There must be a maximum of one attribute instance. There must be…
A: Below are the correct options: There must be a maximum of one attribute instance. There must be at…
Q: You must analyze the entities identified including the bridges: • Entity name • Entity description…
A: entity name:class level description:the class level entity acts as a base class for the classes…
Q: What is the Entity-Relationship Model and what is its purpose?
A: What is the Entity-Relationship Model what is its purpose? ER model stands for Entity Relationship…
Q: Define an attribute, and provide three examples.
A: Attribute: An attribute is a specification defining an entity, feature, or file property. This can…
Q: Using the relations ATTACHED, normalize your relations into first, second, and third normal forms.…
A:
Q: Examine the database table choices for subtype associations. What factors would you use to choose…
A: Note: We are only permitted to respond to one question at a time; please submit this if you want a…
Q: am to simple text that anyone understand it without entities , attributes or relationshops word.
A: The above ERD shows the personal vehicle features and activities if we are having a personal for…
Q: Question 3 Discuss in detailed explanation that the concept that an attribute that is part of a…
A: The concept that an attribute that is part of a composite primary key is also a candidatekey:
Q: Create an E-R diagram for FAME based on the enterprise data model you developed in 1-52. Clearly…
A: Given: Create an E-R diagram for FAME based on the enterprise data model you developed in 1-52.…
Q: is a piece of information used to describe an entity. a. Attribute b. Associative Entity Cardinality…
A: Answering 4 and 5. According to the policies I can't solve multiple questions in one question…
Q: b) Identify an attribute in the ER diagram that could represent a derived attribute and explain…
A: Derived attribute is an attribute which can be derived from other attributes.
Q: a) What is the main role of an ER diagram in data modelling? b) How many courses each student can…
A: a) What is the main role of an ER diagram in data modelling? Ans)ER diagram in data modelling helps…

Using the ERD diagram above, identify an attribute that might represent a Derived Attribute. Once you identify, explain why this is so. Is this the only attribute? Are there others?

Step by step
Solved in 2 steps


- Create 3 new users (provide screenshots for each): Name: Thomas Jefferson Username: thomas Password: Monticello Name: Abraham Lincoln Username: abe Password: 4score&7years Name: Benjamin Franklin Username: ben Password: Early2bedEarly2rise b. Create 3 new groups: presidents (members: thomas, abe) continental_congress (members: thomas,ben) us_currency (members: thomas,ben,abe)###Important variables below # gauteng ebp data as a listgauteng = ebp_df['Gauteng'].astype(float).to_list() # dates for twitter tweetsdates = twitter_df['Date'].to_list() # dictionary mapping official municipality twitter handles to the municipality namemun_dict = { '@CityofCTAlerts' : 'Cape Town', '@CityPowerJhb' : 'Johannesburg', '@eThekwiniM' : 'eThekwini' , '@EMMInfo' : 'Ekurhuleni', '@centlecutility' : 'Mangaung', '@NMBmunicipality' : 'Nelson Mandela Bay', '@CityTshwane' : 'Tshwane'} # dictionary of english stopwordsstop_words_dict = { 'stopwords':[ 'where', 'done', 'if', 'before', 'll', 'very', 'keep', 'something', 'nothing', 'thereupon', 'may', 'why', '’s', 'therefore', 'you', 'with', 'towards', 'make', 'really', 'few', 'former', 'during', 'mine', 'do', 'would', 'of', 'off', 'six', 'yourself', 'becoming', 'through', 'seeming', 'hence', 'us', 'anywhere', 'regarding', 'whole', 'down', 'seem', 'whereas', 'to', 'their',…Need help with Excel spreadsheet. Using the table on the Enrollment worksheet, insert a PivotTable on a new worksheet named PivotAnalysis. Complete the following to create your PivotTable. • Add the Fee, Gender, and Class_Name fields to the PivotTable. • Ensure Class_name is in the Rows area. • Move Gender to the Columns area. • In cell B3, replace Column Labels with Gender. In cell B4, replace F with Female. In cell C4, replace M with Male. In cell A3, replace Sum of Fee with Revenue. In celln A4, replace Row Labels with Classes. • Format the Revenue field as Accounting with 0 decimal places. • Resize the column widths as needed. • Apply Light Orange, Pivot Style Light 10 to the PivotTable.
- To create, change, and post journal vouchers, choose _____. (1) Administration → (2) Journal Vouchers → (3) Add Entry to New Voucher. (1) Setup → (2) Journal Vouchers → (3) Add Entry to New Voucher. (1) Financials → (2) Journal Entry → (3) Add Entry to New Voucher. (1) Financials → (2) Journal Vouchers → (3) Add Entry to New Voucher.I have a project I need assistance with using javascript. I am needing to reverese the view order in which the suppliers are when a user clicks on the Supplier field. For example please see image 1. Now I found the code that pulls in that table in on that page: See image 2. The variable: var supplierField = form.addField('custpage_supplier', 'select', 'Supplier', 'customrecord_reorder_suppliers').setLayoutType('startrow'); This is the code and in particular this id: 'customrecord_reorder_suppliers' is pulling in the field values for screen shot 1. However, I am not sure how to change the order view. Currently the order view is: Number Supplier Name => (12344 Walmart) My goal is to change it to: Supplier Name Number => (Walmart 12344) I have tried using the built in JS methods like so: 'customrecord_reorder_suppliers'.split(' ').reverse().join(' ') but to no avail. I also created a new variable and reassigned the initial variable and called the same methods on the new variable…Please select two machine learning classifiers (it can be your two favorites) to predict if a patient has diabetes by following the steps below (you may use Jupyter notebook): 1. download the data using this link: https://www.kaggle.com/datasets/uciml/pima-indians-diabetes-database 2. you need to import all the necessary libraries 3. you need to read the data( you may use Pandas) 4. you will have to perform some feature engineering to replace zero values for features such as glucose, blood pressure and skin thickness, only if these are not alredy presented in the dataset 5. you need to split the data in training sets and testing sets 6. you need to create classifiers models and then train those models on the train set 7. you also need to use the models to predict on the test set 8. you need to report the accuracy of the models by using the accuracy score and confusion matrix 9. if you can please show some visualization like graphs for the accuracy, confusion matrix and the loss and…
- Create a simple contact us page using your own design (contact-page.php) for gettingcontact details of potential customers. Customer information needed are names, digital- address, email, telephone number and message. All fields must be validated using JavaScript only.4. Create a simple database with name nuksoftdb, create a table contactstb to store the contact details. Write appropriate php codes to connect to the database and insert records from the contact page into the database table.You are in charge of designing a location-based search service for Google. When a ner search for a service name on Google map (such as plumber, handyman, the system should generate a ranked list of suggested services. Can you design a ranking algorithm to provide the top 5 services. You can assume you have all y information such as the business website, address, clickthrough dats etc. Your ranking algorithm should take into consideration at least 3 factors and provide rationale for these 3 factors.<!DOCTYPE html ><html> <head><meta charset="utf-8"><title>Black Goose Bistro Summer Menu</title> </head> <body> <div id="info"><h1>Black Goose Bistro • Summer Menu</h1> <p>Baker's Corner, Seekonk, Massachusetts<br><span class="label">Hours: Monday through Thursday:</span> 11 to 9, <span class="label">Friday and Saturday;</span> 11 to midnight</p></div> <div id="appetizers"><h2>Appetizers</h2><p>This season, we explore the spicy flavors of the southwest in our appetizer collection.</p> <dl><dt>Black bean purses</dt><dd>Spicy black bean and a blend of mexican cheeses wrapped in sheets of phyllo and baked until golden. <span class="price">$3.95</span></dd> <dt class="newitem">Southwestern napoleons with lump crab — <strong>new item!</strong></dt><dd>Layers…
- You have seen this link before, if you already input this data into a spreadsheet you can go back to it and now run some new tests. Go to this link: http://www.shortlist.com/entertainment/books/actor-heights-versus-character-heights (Links to an external site.)Links to an external site.. In SPSS, excel or PsPP (or by hand if you wish) compare the heights between these two groups. Be sure to sure to use the correct t-test (are these independant samples or paired samples?). Report the t statistic and the p value for you calculation and interpret (are these two groups significantly different from each other?//ER diagram not handwritten please.Use any tool and send the image //Also can the question be answered in subparts according to the question numbers please //Need two parts of the question answered please Terrific Airlines is a newly formed airline aimed at the burgeoning market of clandestine travellers (fugitives, spies, confidence tricksters, scoundrels, deadbeats, cheating spouses, politicians, etc.). Terrific Airlines needs a database to track flights, customers, fares, airplane performance, and personnel assignment. Since Terrific Airlines is promoted as a “…fast way out of town,” individual seats are not assigned, and flights of other carriers are not tracked. More specific notes about Terrific Airlines are listed below: Information about a route includes its unique number, its origin, its destination, and estimated departure and arrival times. To reduce costs, Terrific Airlines only has non-stop flights with a single origin and destination. Flights are scheduled for a route…Discussion Board 3: Clutter (Initial post due 1/27) This discussion focuses on clutter, specifically in data visualizations. Consider the types of clutter discussed in chapter 3. Locate a data visualization online that is cluttered. Make sure to select a different example than others that are posted. Address the following points in about 200 words: Describe the data visualization and how it is cluttered Outline changes you would make to declutter the visualization based on the chapter reading. Provide a link to the data visualization you discussed.