Using the financial statements mentioned above estimate the annual rate of interest paid by the corporation (cost of debt). Also, find the tax rate and capitalization ratio (proportions among equity and debt). Using these values that you have found estimate the annual weighted cost of capital (WACC) of the corporation.
Using the financial statements mentioned above estimate the annual rate of interest paid by the corporation (cost of debt). Also, find the tax rate and capitalization ratio (proportions among equity and debt). Using these values that you have found estimate the annual weighted cost of capital (WACC) of the corporation.

Cornerstones of Financial Accounting
4th Edition
ISBN:9781337690881
Author:Jay Rich, Jeff Jones
Publisher:Jay Rich, Jeff Jones
Chapter9: Long-term Liabilities
Section: Chapter Questions
Problem 103.1C: Leverage Cook Corporation issued financial statements at December 31, 2019, that include the...

Related questions
Question
Using the financial statements mentioned above estimate the annual rate of interest paid by the corporation (cost of debt). Also, find the tax rate and capitalization ratio (proportions among equity and debt). Using these values that you have found estimate the annual weighted cost of capital (WACC) of the corporation.
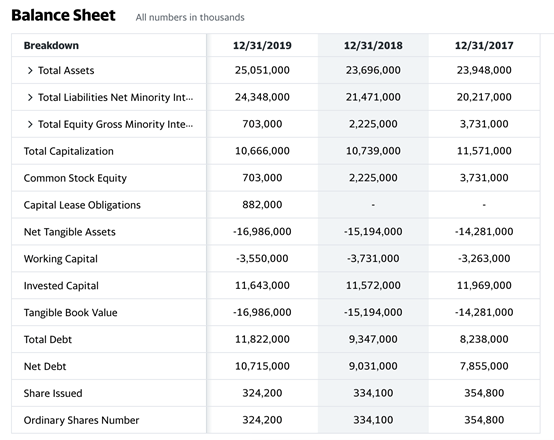
Transcribed Image Text:Balance Sheet
All numbers in thousands
Breakdown
12/31/2019
12/31/2018
12/31/2017
> Total Assets
25,051,000
23,696,000
23,948,000
> Total Liabilities Net Minority Int.
24,348,000
21,471,000
20,217,000
> Total Equity Gross Minority Inte.
703,000
2,225,000
3,731,000
Total Capitalization
10,666,000
10,739,000
11,571,000
Common Stock Equity
703,000
2,225,000
3,731,000
Capital Lease Obligations
882,000
Net Tangible Assets
-16,986,000
-15,194,000
-14,281,000
Working Capital
-3,550,000
-3,731,000
-3,263,000
Invested Capital
11,643,000
11,572,000
11,969,000
Tangible Book Value
-16,986,000
-15,194,000
-14,281,000
Total Debt
11,822,000
9,347,000
8,238,000
Net Debt
10,715,000
9,031,000
7,855,000
Share Issued
324,200
334,100
354,800
Ordinary Shares Number
324,200
334,100
354,800
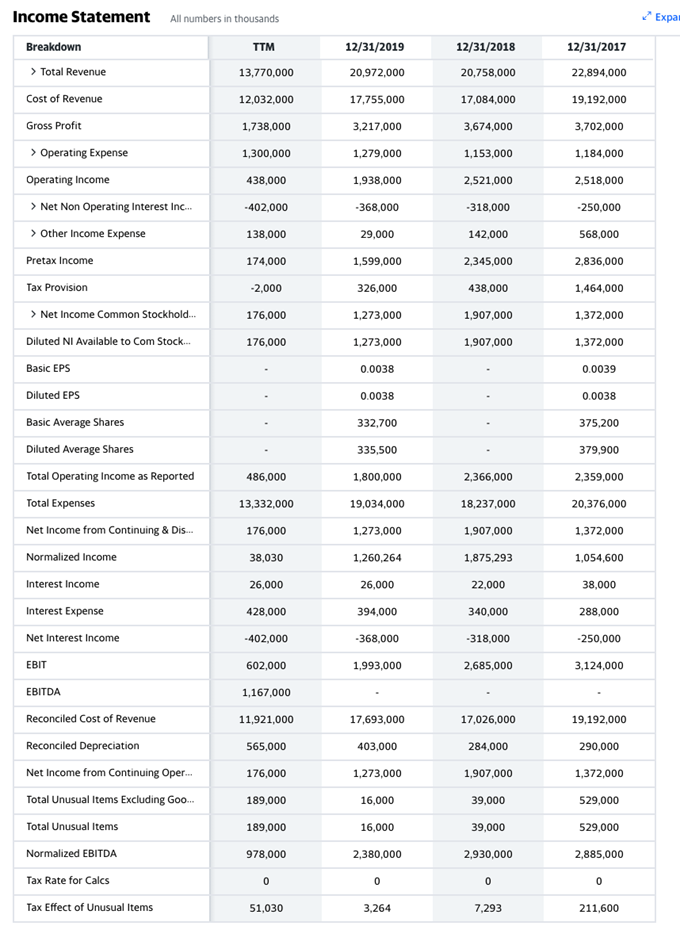
Transcribed Image Text:Income Statement
All numbers in thousands
/ Expar
Breakdown
TTM
12/31/2019
12/31/2018
12/31/2017
> Total Revenue
13,770,000
20,972,000
20,758,000
22,894,000
Cost of Revenue
12,032,000
17,755,000
17,084,000
19,192,000
Gross Profit
1,738,000
3,217,000
3,674,000
3,702,000
> Operating Expense
1,184,000
1,300,000
1,279,000
1,153,000
Operating Income
438,000
1,938,000
2,521,000
2,518,000
> Net Non Operating Interest Inc.
-402,000
-368,000
-318,000
-250,000
> Other Income Expense
138,000
29,000
142,000
568,000
Pretax Income
174,000
1,599,000
2,345,000
2,836,000
Таx Provision
-2,000
326,000
438,000
1,464,000
> Net Income Common Stockhold.
176,000
1,273,000
1,907,000
1,372,000
Diluted NI Available to Com Stock.
176,000
1,273,000
1,907,000
1,372,000
Basic EPS
0.0038
0.0039
Diluted EPS
0.0038
0.0038
Basic Average Shares
332,700
375,200
Diluted Average Shares
335,500
379,900
Total Operating Income as Reported
486,000
1,800,000
2,366,000
2,359,000
Total Expenses
13,332,000
19,034,000
18,237,000
20,376,000
Net Income from Continuing & Dis.
176,000
1,273,000
1,907,000
1,372,000
Normalized Income
38,030
1,260,264
1,875,293
1,054,600
Interest Income
26,000
26,000
22,000
38,000
Interest Expense
428,000
394,000
340,000
288,000
Net Interest Income
-402,000
-368,000
-318,000
-250,000
EBIT
602,000
1,993,000
2,685,000
3,124,000
EBITDA
1,167,000
Reconciled Cost of Revenue
11,921,000
17,693,000
17,026,000
19,192,000
Reconciled Depreciation
565,000
403,000
284,000
290,000
Net Income from Continuing Oper.
176,000
1,273,000
1,907,000
1,372,000
Total Unusual Items Excluding Goo.
189,000
16,000
39,000
529,000
Total Unusual Items
189,000
16,000
39,000
529,000
Normalized EBITDA
978,000
2,380,000
2,930,000
2,885,000
Tax Rate for Calcs
Tax Effect of Unusual Items
51,030
3,264
7,293
211,600
Expert Solution
Step 1
Weighted Average Cost of Capital (WACC) is the total cost of capital employed by an entity using equity and debt finance sources. Weights are assigned to equity and debt based on their proportion of total capital employed and the respective costs are assigned to figure out the WACC.

Trending now
This is a popular solution!

Step by step
Solved in 4 steps with 4 images

Knowledge Booster


Learn more about
Need a deep-dive on the concept behind this application? Look no further. Learn more about this topic, accounting and related others by exploring similar questions and additional content below.Recommended textbooks for you
Cornerstones of Financial Accounting
Accounting
ISBN:
9781337690881
Author:
Jay Rich, Jeff Jones
Publisher:
Cengage Learning
Cornerstones of Financial Accounting
Accounting
ISBN:
9781337690881
Author:
Jay Rich, Jeff Jones
Publisher:
Cengage Learning