Using the = table The Standard Normal Distribution Table), find the critical value (or values) for the left-tailed test with a = 0.05. Round to two decimal places, and enter the answers separated by a comma if needed. Critical value(s) :
Using the = table The Standard Normal Distribution Table), find the critical value (or values) for the left-tailed test with a = 0.05. Round to two decimal places, and enter the answers separated by a comma if needed. Critical value(s) :

Algebra & Trigonometry with Analytic Geometry
13th Edition
ISBN:9781133382119
Author:Swokowski
Publisher:Swokowski
Chapter7: Analytic Trigonometry
Section7.6: The Inverse Trigonometric Functions
Problem 93E

Related questions
Question
need help on these, everything you nrrf is in the screenshot
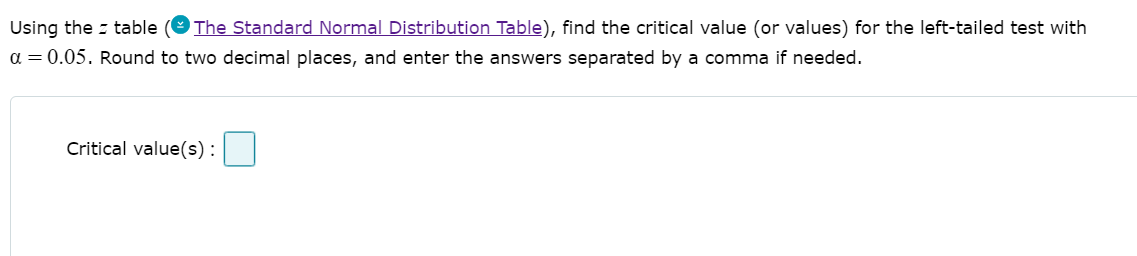
Transcribed Image Text:Using the z table
The Standard Normal Distribution Table), find the critical value (or values) for the left-tailed test with
a = 0.05. Round to two decimal places, and enter the answers separated by a comma if needed.
Critical value(s):
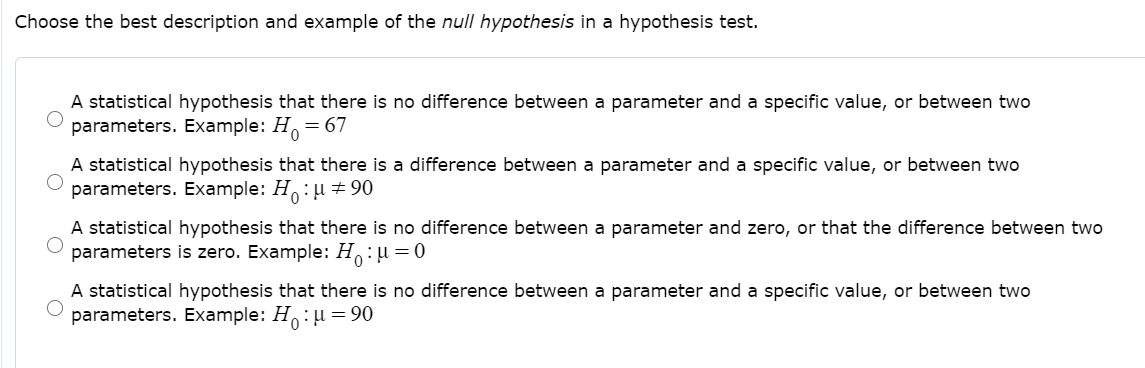
Transcribed Image Text:Choose the best description and example of the null hypothesis in a hypothesis test.
A statistical hypothesis that there is no difference between a parameter and a specific value, or between two
parameters. Example: H.
= 67
A statistical hypothesis that there is a difference between a parameter and a specific value, or between two
parameters. Example: H:µ ± 90
A statistical hypothesis that there is no difference between a parameter and zero, or that the difference between two
parameters is zero. Example: H:u =0
A statistical hypothesis that there is no difference between a parameter and a specific value, or between two
parameters. Example: H: u = 90
Expert Solution
This question has been solved!
Explore an expertly crafted, step-by-step solution for a thorough understanding of key concepts.

This is a popular solution!

Trending now
This is a popular solution!

Step by step
Solved in 2 steps with 1 images

Knowledge Booster


Learn more about
Need a deep-dive on the concept behind this application? Look no further. Learn more about this topic, probability and related others by exploring similar questions and additional content below.Recommended textbooks for you
Algebra & Trigonometry with Analytic Geometry
Algebra
ISBN:
9781133382119
Author:
Swokowski
Publisher:
Cengage
Algebra & Trigonometry with Analytic Geometry
Algebra
ISBN:
9781133382119
Author:
Swokowski
Publisher:
Cengage