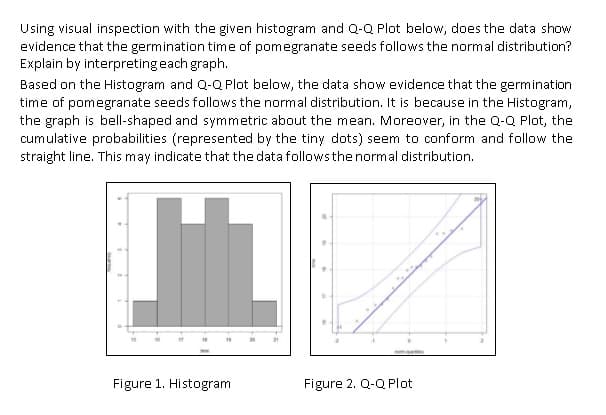
Using visual inspection with the given histogram and Q-Q Plot below, does the data show evidence that the germination time of pomegranate seeds follows the normal distribution? Explain by interpreting each graph. Based on the Histogram and Q-Q Plot below, the data show evidence that the germination time of pomegranate seeds follows the normal distribution. It is because in the Histogram, the graph is bell-shaped and symmetric about the mean. Moreover, in the Q-Q Plot, the cumulative probabilities (represented by the tiny dots) seem to conform and follow the straight line. This may indicate that the data follows the normal distribution.
Using visual inspection with the given histogram and Q-Q Plot below, does the data show evidence that the germination time of pomegranate seeds follows the normal distribution? Explain by interpreting each graph. Based on the Histogram and Q-Q Plot below, the data show evidence that the germination time of pomegranate seeds follows the normal distribution. It is because in the Histogram, the graph is bell-shaped and symmetric about the mean. Moreover, in the Q-Q Plot, the cumulative probabilities (represented by the tiny dots) seem to conform and follow the straight line. This may indicate that the data follows the normal distribution.
Glencoe Algebra 1, Student Edition, 9780079039897, 0079039898, 2018
18th Edition
ISBN:9780079039897
Author:Carter
Publisher:Carter
Chapter10: Statistics
Section10.4: Distributions Of Data
Problem 19PFA
Related questions
Question

Transcribed Image Text:Using visual inspection with the given histogram and Q-Q Plot below, does the data show
evidence that the germination time of pomegranate seeds follows the normal distribution?
Explain by interpretingeach graph.
Based on the Histogram and Q-Q Plot below, the data show evidence that the germination
time of pomegranate seeds follows the normal distribution. It is because in the Histogram,
the graph is bell-shaped and symmetric about the mean. Moreover, in the Q-Q Plot, the
cumulative probabilities (represented by the tiny dots) seem to conform and follow the
straight line. This may indicate that the data followsthe normal distribution.
Figure 1. Histogram
Figure 2. Q-Q Plot
Expert Solution
This question has been solved!
Explore an expertly crafted, step-by-step solution for a thorough understanding of key concepts.
Step by step
Solved in 2 steps

Recommended textbooks for you

Glencoe Algebra 1, Student Edition, 9780079039897…
Algebra
ISBN:
9780079039897
Author:
Carter
Publisher:
McGraw Hill

Glencoe Algebra 1, Student Edition, 9780079039897…
Algebra
ISBN:
9780079039897
Author:
Carter
Publisher:
McGraw Hill