Washington County’s Board of Representatives is considering the construction of a longer runway at the county airport. Currently, the airport can handle only private aircraft and small commuter jets. A new, long runway would enable the airport to handle the midsize jets used on many domestic flights. Data pertinent to the board’s decision appear below. Cost of acquiring additional land for runway $ 70,000 Cost of runway construction 200,000 Cost of extending perimeter fence 29,840 Cost of runway lights 39,600 Annual cost of maintaining new runway 28,000 Annual incremental revenue from landing fees 40,000 In addition to the preceding data, two other facts are relevant to the decision. First, a longer runway will require a new snowplow, which will cost $100,000. The old snowplow could be sold now for $10,000. The new, larger plow will cost $12,000 more in annual operating costs. Second, the County Board of Representatives believes that the proposed long runway, and the major jet service it will bring to the county, will increase economic activity in the community. The board projects that the increased economic activity will result in $64,000 per year in additional tax revenue for the county. In analyzing the runway proposal, the board has decided to use a 10-year time horizon. The county’s hurdle rate for capital projects is 12 percent. Use Appendix A for your reference. (Use appropriate factor(s) from the tables provided.) Required: 1. Prepare a net-present-value analysis of the proposed long runway.


Washington County’s Board of Representatives is considering the construction of a longer runway at the county airport. Currently, the airport can handle only private aircraft and small commuter jets. A new, long runway would enable the airport to handle the midsize jets used on many domestic flights. Data pertinent to the board’s decision appear below.
| Cost of acquiring additional land for runway | $ | 70,000 | |
| Cost of runway construction | 200,000 | ||
| Cost of extending perimeter fence | 29,840 | ||
| Cost of runway lights | 39,600 | ||
| Annual cost of maintaining new runway | 28,000 | ||
| Annual incremental revenue from landing fees | 40,000 | ||
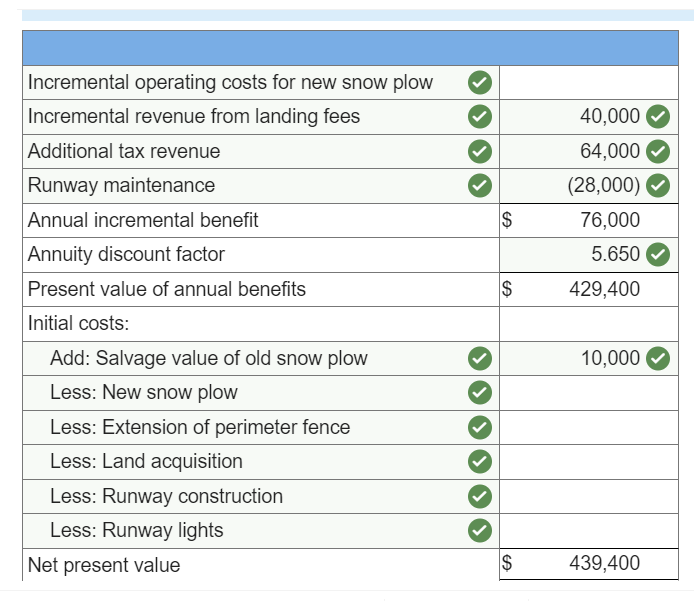
In addition to the preceding data, two other facts are relevant to the decision. First, a longer runway will require a new snowplow, which will cost $100,000. The old snowplow could be sold now for $10,000. The new, larger plow will cost $12,000 more in annual operating costs. Second, the County Board of Representatives believes that the proposed long runway, and the major jet service it will bring to the county, will increase economic activity in the community. The board projects that the increased economic activity will result in $64,000 per year in additional tax revenue for the county.
In analyzing the runway proposal, the board has decided to use a 10-year time horizon. The county’s hurdle rate for capital projects is 12 percent.
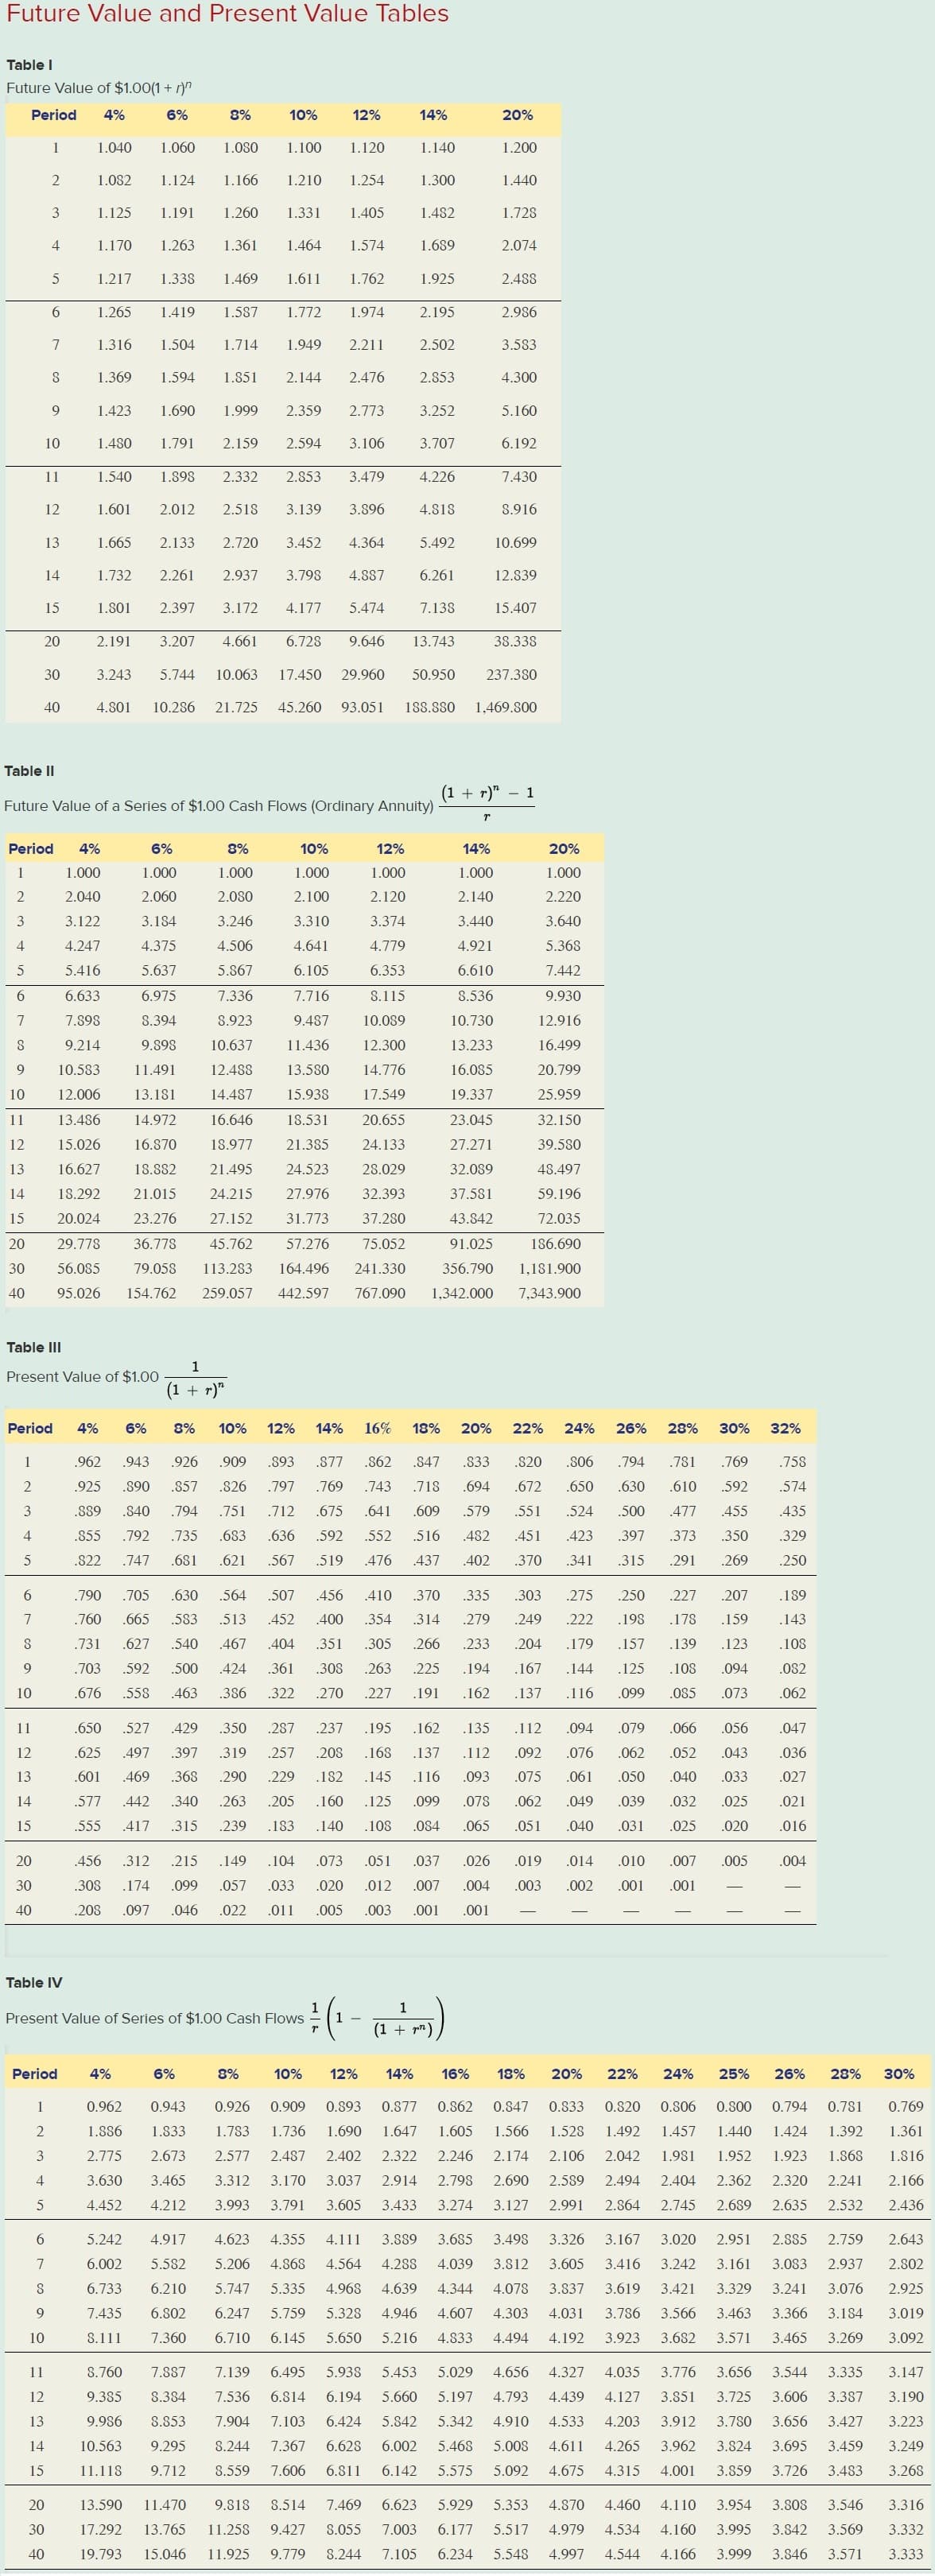
Use Appendix A for your reference. (Use appropriate factor(s) from the tables provided.)
Required:
1. Prepare a net-present-value analysis of the proposed long runway.

Step by step
Solved in 3 steps with 2 images


