We want to conduct a hypothesis test of the claim that for middle-aged adults the population mean of their cholesterol levels is more than 201.3 mg dL choose a random sample of such levels. The sample has a mean of 197.3 mg dL mg and a standard deviation of 18 dL For each of the following sampling scenarios, choose an appropriate test statistic for our hypothesis test on the population mean. Then calculate that statist Round your answers to two decimal places. (a) The sample has size 110, and it is from a non-normally distributed population with a known standard deviation of 19.2. 0²= ot= O It is unclear which test statistic to use. 4 (b) The sample has size 19, and it is from a normally distributed population with an unknown standard deviation. 0²= O ot= X We S
We want to conduct a hypothesis test of the claim that for middle-aged adults the population mean of their cholesterol levels is more than 201.3 mg dL choose a random sample of such levels. The sample has a mean of 197.3 mg dL mg and a standard deviation of 18 dL For each of the following sampling scenarios, choose an appropriate test statistic for our hypothesis test on the population mean. Then calculate that statist Round your answers to two decimal places. (a) The sample has size 110, and it is from a non-normally distributed population with a known standard deviation of 19.2. 0²= ot= O It is unclear which test statistic to use. 4 (b) The sample has size 19, and it is from a normally distributed population with an unknown standard deviation. 0²= O ot= X We S

A First Course in Probability (10th Edition)
10th Edition
ISBN:9780134753119
Author:Sheldon Ross
Publisher:Sheldon Ross
Chapter1: Combinatorial Analysis
Section: Chapter Questions
Problem 1.1P: a. How many different 7-place license plates are possible if the first 2 places are for letters and...

Related questions
Question
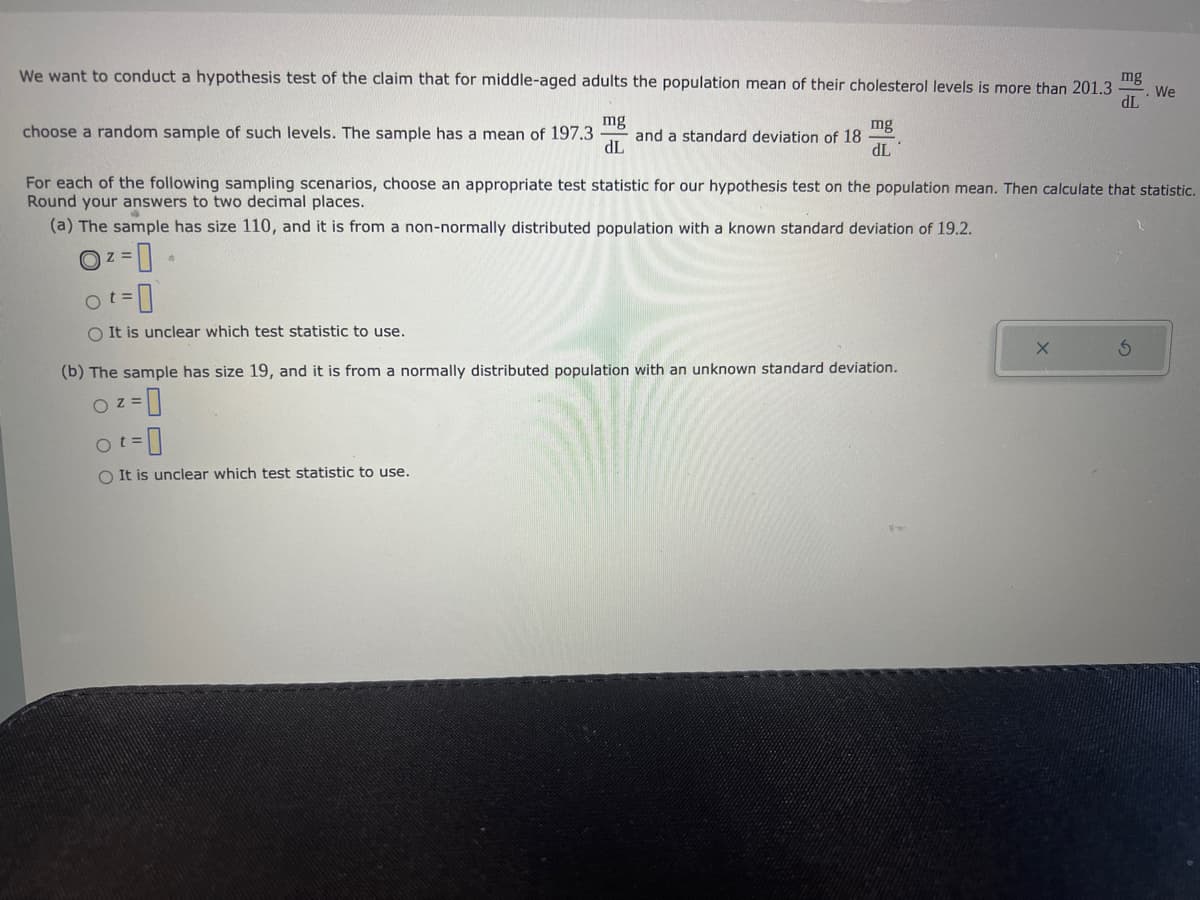
Transcribed Image Text:We want to conduct a hypothesis test of the claim that for middle-aged adults the population mean of their cholesterol levels is more than 201.3
mg
dL
mg
choose a random sample of such levels. The sample has a mean of 197.3 and a standard deviation of 18
dL
mg
dL
For each of the following sampling scenarios, choose an appropriate test statistic for our hypothesis test on the population mean. Then calculate that statistic.
Round your answers to two decimal places.
(a) The sample has size 110, and it is from a non-normally distributed population with a known standard deviation of 19.2.
0²=
ot=
O It is unclear which test statistic to use.
A
(b) The sample has size 19, and it is from a normally distributed population with an unknown standard deviation.
0²=
ot = 0
It is unclear which test statistic to use.
O
X
We
S
Expert Solution
This question has been solved!
Explore an expertly crafted, step-by-step solution for a thorough understanding of key concepts.

Step by step
Solved in 3 steps

Recommended textbooks for you
A First Course in Probability (10th Edition)
Probability
ISBN:
9780134753119
Author:
Sheldon Ross
Publisher:
PEARSON

A First Course in Probability (10th Edition)
Probability
ISBN:
9780134753119
Author:
Sheldon Ross
Publisher:
PEARSON