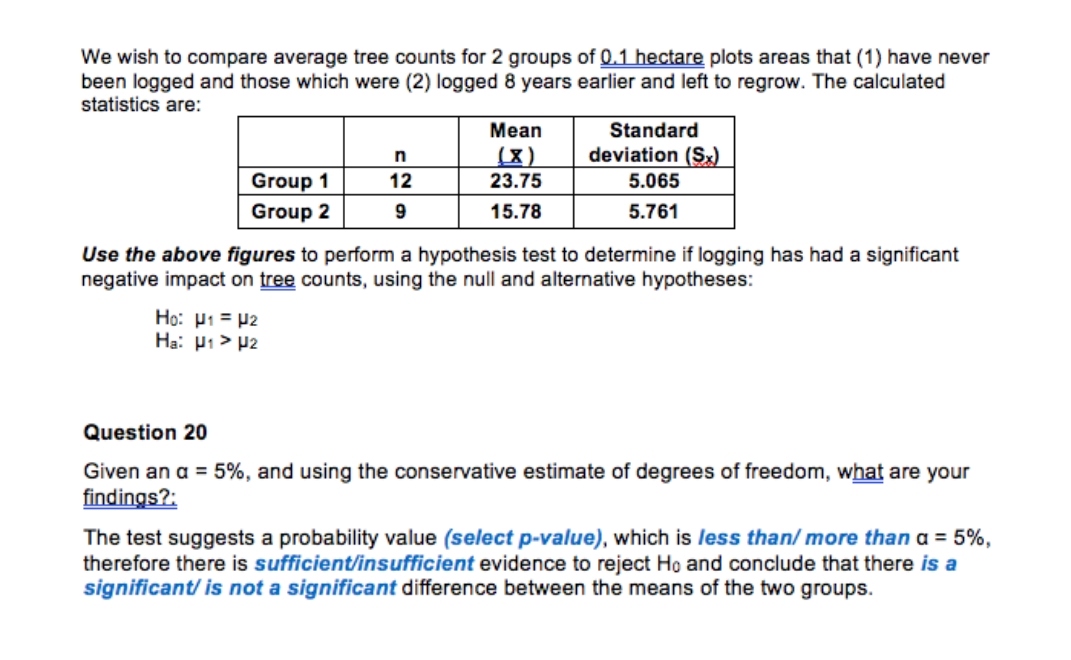
We wish to compare average tree counts for 2 groups of 0.1 hectare plots areas that (1) have never been logged and those which were (2) logged 8 years earlier and left to regrow. The calculated statistics are: Mean Standard (x) deviation (Sx) Group 1 12 23.75 5.065 Group 2 15.78 5.761 Use the above figures to perform a hypothesis test to determine if logging has had a significant negative impact on tree counts, using the null and alternative hypotheses: Họ: H1 = P2 Hạ: H1 > P2 Question 20 Given an a = 5%, and using the conservative estimate of degrees of freedom, what are your findings?: The test suggests a probability value (select p-value), which is less than/ more than a = 5%, therefore there is sufficient/insufficient evidence to reject Ho and conclude that there is a significant/ is not a significant difference between the means of the two groups.
We wish to compare average tree counts for 2 groups of 0.1 hectare plots areas that (1) have never been logged and those which were (2) logged 8 years earlier and left to regrow. The calculated statistics are: Mean Standard (x) deviation (Sx) Group 1 12 23.75 5.065 Group 2 15.78 5.761 Use the above figures to perform a hypothesis test to determine if logging has had a significant negative impact on tree counts, using the null and alternative hypotheses: Họ: H1 = P2 Hạ: H1 > P2 Question 20 Given an a = 5%, and using the conservative estimate of degrees of freedom, what are your findings?: The test suggests a probability value (select p-value), which is less than/ more than a = 5%, therefore there is sufficient/insufficient evidence to reject Ho and conclude that there is a significant/ is not a significant difference between the means of the two groups.

A First Course in Probability (10th Edition)
10th Edition
ISBN:9780134753119
Author:Sheldon Ross
Publisher:Sheldon Ross
Chapter1: Combinatorial Analysis
Section: Chapter Questions
Problem 1.1P: a. How many different 7-place license plates are possible if the first 2 places are for letters and...

Related questions
Question
Transcribed Image Text:We wish to compare average tree counts for 2 groups of 0.1 hectare plots areas that (1) have never
been logged and those which were (2) logged 8 years earlier and left to regrow. The calculated
statistics are:
Mean
Standard
(x)
deviation (S)
Group 1
12
23.75
5.065
Group 2
9.
15.78
5.761
Use the above figures to perform a hypothesis test to determine if logging has had a significant
negative impact on tree counts, using the null and alternative hypotheses:
Họ: H1 = P2
Ha: H1> P2
Question 20
Given an a = 5%, and using the conservative estimate of degrees of freedom, what are your
findings?:
The test suggests a probability value (select p-value), which is less than/ more than a = 5%,
therefore there is sufficient/insufficient evidence to reject Ho and conclude that there is a
significant/ is not a significant difference between the means of the two groups.
Expert Solution
This question has been solved!
Explore an expertly crafted, step-by-step solution for a thorough understanding of key concepts.

Step by step
Solved in 3 steps with 3 images

Recommended textbooks for you
A First Course in Probability (10th Edition)
Probability
ISBN:
9780134753119
Author:
Sheldon Ross
Publisher:
PEARSON

A First Course in Probability (10th Edition)
Probability
ISBN:
9780134753119
Author:
Sheldon Ross
Publisher:
PEARSON