What have been the possible reasons for the changes in ROEs ? •Decompose the (Return on Equity) ROE into the main components: ROA and EM •Analyse the sources of Return on Asset (ROA) : Asset Utilisation and Profit Margin ratios. (PM) •Identify the sources of the changes in AU and PM
What have been the possible reasons for the changes in ROEs ? •Decompose the (Return on Equity) ROE into the main components: ROA and EM •Analyse the sources of Return on Asset (ROA) : Asset Utilisation and Profit Margin ratios. (PM) •Identify the sources of the changes in AU and PM

Chapter3: Corporations: Introduction And Operating Rules
Section: Chapter Questions
Problem 55P

Related questions
Question
What have been the possible reasons for the changes in ROEs ?
•Decompose the (
•Analyse the sources of
•Identify the sources of the changes in AU and PM
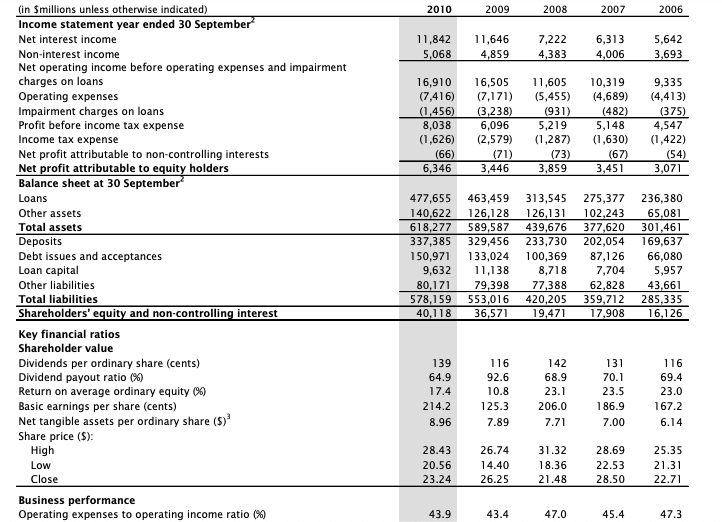
Transcribed Image Text:(in Smillions unless otherwise indicated)
Income statement year ended 30 September
2010
2009
2008
2007
2006
Net interest income
11,842
11,646
7,222
6,313
5,642
Non-interest income
5,068
4,859
4,383
4,006
3,693
Net operating income before operating expenses and impairment
charges on loans
Operating expenses
Impairment charges on loans
Profit before income tax expense
16,910
(7,416)
(1,456)
8,038
(1,626)
(66)
6,346
16,505
(7,171)
(3,238)
6,096
(2,579)
(71)
3,446
11,605
10,319
(4,689)
9,335
(5,455)
(4,413)
(375)
4,547
(1,422)
(54)
3,071
(931)
5,219
(482)
5,148
Income tax expense
(1,287)
(1,630)
Net profit attributable to non-controlling interests
Net profit attributable to equity holders
Balance sheet at 30 September
(73)
3,859
(67)
3,451
Loans
477,655
140,622
618,277
337,385
150,971
9,632
80,171
578,159
40,118
463,459
126,128
589,587
329,456
133,024
11,138
79,398
553,016
36,571
313,545
275,377
236,380
65,081
301,461
169,637
66,080
5,957
Other assets
126,131
102,243
Total assets
Deposits
Debt issues and acceptances
Loan capital
439,676
377,620
233,730
202,054
100,369
87,126
8,718
7,704
Other liabilities
77,388
62,828
Total liabilities
Shareholders' equity and non-controlling interest
420,205
19,471
43,661
285,335
16,126
359,712
17,908
Key financial ratios
Shareholder value
Dividends per ordinary share (cents)
Dividend payout ratio (%)
Return on average ordinary equity (%)
Basic earnings per share (cents)
Net tangible assets per ordinary share ($)
139
116
142
131
116
64.9
92.6
68.9
70.1
69.4
17.4
10.8
23.1
23.5
23.0
214.2
125.3
206.0
186.9
167.2
8.96
7.89
7.71
7.00
6.14
Share price ($):
High
28.43
26.74
31.32
28.69
25.35
Low
20.56
14.40
18.36
22.53
21.31
Close
23.24
26.25
21.48
28.50
22.71
Business performance
Operating expenses to operating income ratio (%)
43.9
43.4
47.0
45.4
47.3
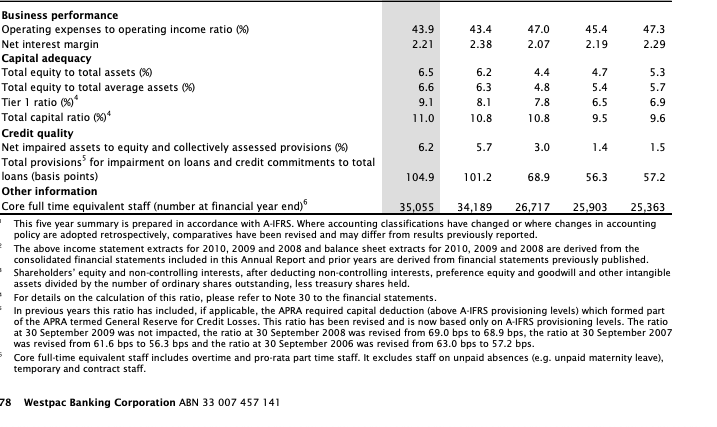
Transcribed Image Text:Business performance
Operating expenses to operating income ratio (%)
Net interest margin
Capital adequacy
Total equity to total assets (%)
Total equity to total average assets (%)
Tier I ratio 0*
Total capital ratio (%6)*
Credit quality
Net impaired assets to equity and collectively assessed provisions (%)
Total provisions for impairment on loans and credit commitments to total
loans (basis points)
43.9
43.4
47.0
45.4
47.3
2.21
2.38
2.07
2.19
2.29
6.5
6.2
4.4
4.7
5.3
6.6
6.3
4.8
5.4
5.7
9.1
8.1
7.8
6.5
6.9
11.0
10.8
10.8
9.5
9.6
6.2
5.7
3.0
1.4
1.5
104.9
101.2
68.9
56.3
57.2
Other information
Core full time equivalent staff (number at financial year end)
35,055
34,189
26,717
25,903
25,363
This five year summary is prepared in accordance with A-IFRS. Where accounting classifications have changed or where changes in accounting
policy are adopted retrospectively, comparatives have been revised and may differ from results previously reported.
The above income statement extracts for 2010, 2009 and 2008 and balance sheet extracts for 2010, 2009 and 2008 are derived from the
consolidated financial statements included in this Annual Report and prior years are derived from financial statements previously published.
Shareholders' equity and non-controlling interests, after deducting non-controlling interests, preference equity and goodwill and other intangible
assets divided by the number of ordinary shares outstanding, less treasury shares held.
For details on the calculation of this ratio, please refer to Note 30 to the financial statements.
In previous years this ratio has included, if applicable, the APRA required capital deduction (above A-IFRS provisioning levels) which formed part
of the APRA termed General Reserve for Credit Losses. This ratio has been revised and is now based only on A-IFRS provisioning levels. The ratio
at 30 September 2009 was not impacted, the ratio at 30 September 2008 was revised from 69.0 bps to 68.9 bps, the ratio at 30 September 2007
was revised from 61.6 bps to 56.3 bps and the ratio at 30 September 2006 was revised from 63.0 bps to 57.2 bps.
Core full-time equivalent staff includes overtime and pro-rata part time staff. It excludes staff on unpaid absences (e.g. unpaid maternity leave),
temporary and contract staff.
78 Westpac Banking Corporation ABN 33 007 457 141
Expert Solution
This question has been solved!
Explore an expertly crafted, step-by-step solution for a thorough understanding of key concepts.

Step by step
Solved in 4 steps

Knowledge Booster


Learn more about
Need a deep-dive on the concept behind this application? Look no further. Learn more about this topic, finance and related others by exploring similar questions and additional content below.Recommended textbooks for you
Principles of Accounting Volume 1
Accounting
ISBN:
9781947172685
Author:
OpenStax
Publisher:
OpenStax College
Principles of Accounting Volume 1
Accounting
ISBN:
9781947172685
Author:
OpenStax
Publisher:
OpenStax College
Individual Income Taxes
Accounting
ISBN:
9780357109731
Author:
Hoffman
Publisher:
CENGAGE LEARNING - CONSIGNMENT

College Accounting, Chapters 1-27
Accounting
ISBN:
9781337794756
Author:
HEINTZ, James A.
Publisher:
Cengage Learning,