What is the answer to problem #1 in the pi

College Algebra
7th Edition
ISBN:9781305115545
Author:James Stewart, Lothar Redlin, Saleem Watson
Publisher:James Stewart, Lothar Redlin, Saleem Watson
Chapter1: Equations And Graphs
Section: Chapter Questions
Problem 9P: Life Expectancy The average life expectancy in the United States has been rising steadily over the...
icon
Related questions
Topic Video
Question

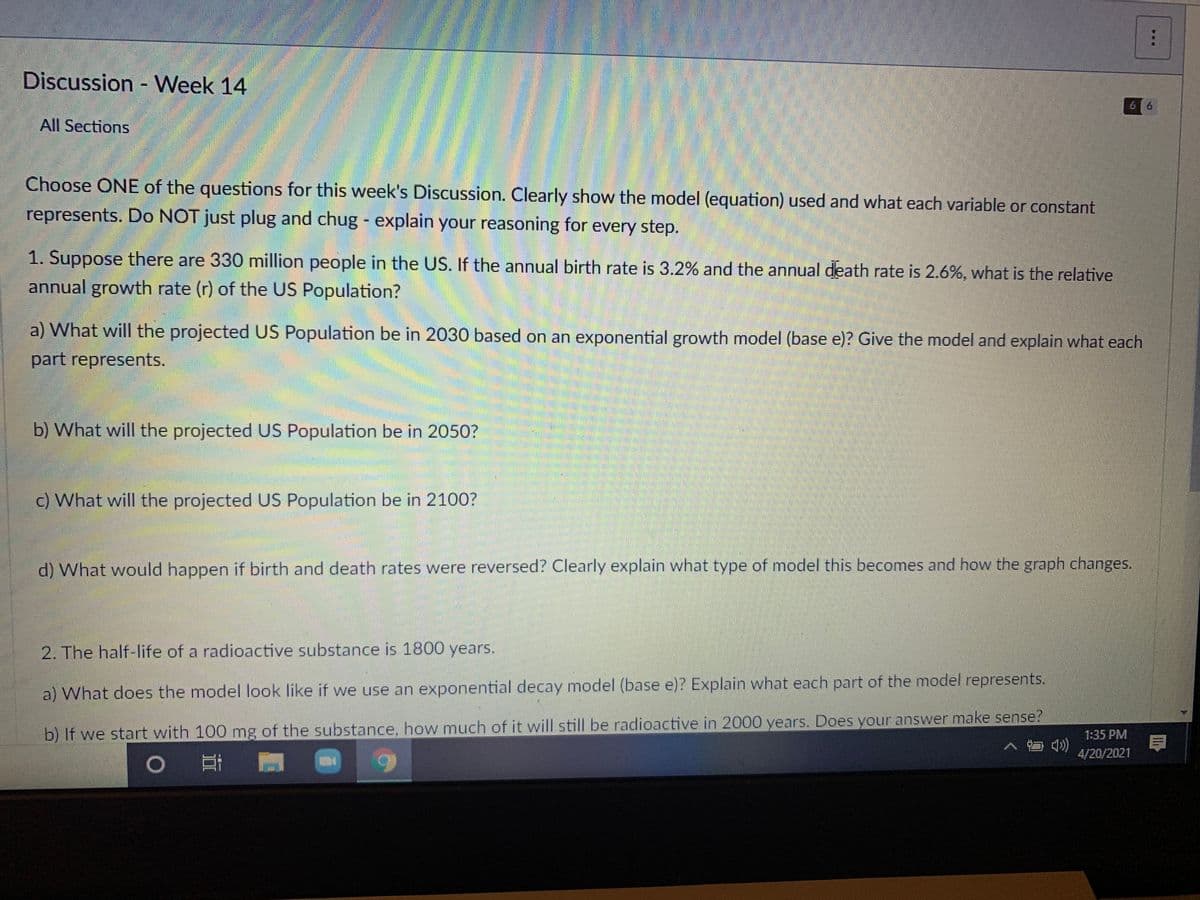
What is the answer to problem #1 in the picture? 

Discussion - Week 14
6 6
All Sections
Choose ONE of the questions for this week's Discussion. Clearly show the model (equation) used and what each variable or constant
represents. Do NOT just plug and chug - explain your reasoning for every step.
1. Suppose there are 330 million people in the US. If the annual birth rate is 3.2% and the annual death rate is 2.6%, what is the relative
annual growth rate (r) of the US Population?
a) What will the projected US Population be in 2030 based on an exponential growth model (base e)? Give the model and explain what each
part represents.
b) What will the projected US Population be in 2050?
c) What will the projected US Population be in 2100?
d) What would happen if birth and death rates were reversed? Clearly explain what type of model this becomes and how the graph changes.
2. The half-life of a radioactive substance is 1800 years.
a) What does the model look like if we use an exponential decay model (base e)? Explain what each part of the model represents.
b) If we start with 100 mg of the substance, how much of it will still be radioactive in 2000 years. Does your answer make sense?
口 )
1:35 PM
4/20/2021
6.
...
Transcribed Image Text:Discussion - Week 14 6 6 All Sections Choose ONE of the questions for this week's Discussion. Clearly show the model (equation) used and what each variable or constant represents. Do NOT just plug and chug - explain your reasoning for every step. 1. Suppose there are 330 million people in the US. If the annual birth rate is 3.2% and the annual death rate is 2.6%, what is the relative annual growth rate (r) of the US Population? a) What will the projected US Population be in 2030 based on an exponential growth model (base e)? Give the model and explain what each part represents. b) What will the projected US Population be in 2050? c) What will the projected US Population be in 2100? d) What would happen if birth and death rates were reversed? Clearly explain what type of model this becomes and how the graph changes. 2. The half-life of a radioactive substance is 1800 years. a) What does the model look like if we use an exponential decay model (base e)? Explain what each part of the model represents. b) If we start with 100 mg of the substance, how much of it will still be radioactive in 2000 years. Does your answer make sense? 口 ) 1:35 PM 4/20/2021 6. ...
Expert Solution
trending now

Trending now

This is a popular solution!

steps

Step by step

Solved in 5 steps

Blurred answer
Knowledge Booster
Permutation and Combination
Learn more about
Need a deep-dive on the concept behind this application? Look no further. Learn more about this topic, advanced-math and related others by exploring similar questions and additional content below.
Similar questions
Recommended textbooks for you
College Algebra
College Algebra
Algebra
ISBN:
9781305115545
Author:
James Stewart, Lothar Redlin, Saleem Watson
Publisher:
Cengage Learning
Algebra and Trigonometry (MindTap Course List)
Algebra
ISBN:
9781305071742
Author:
James Stewart, Lothar Redlin, Saleem Watson
Publisher:
Cengage Learning
Functions and Change: A Modeling Approach to Coll…
Algebra
ISBN:
9781337111348
Author:
Bruce Crauder, Benny Evans, Alan Noell
Publisher:
Cengage Learning