
Financial Reporting, Financial Statement Analysis and Valuation
8th Edition
ISBN:9781285190907
Author:James M. Wahlen, Stephen P. Baginski, Mark Bradshaw
Publisher:James M. Wahlen, Stephen P. Baginski, Mark Bradshaw
Chapter8: Investing Activities
Section: Chapter Questions
Problem 14QE

Related questions

Concept explainers
Financial Ratios
A Ratio refers to a figure calculated as a reference to the relationship of two or more numbers and can be expressed as a fraction, proportion, percentage, or the number of times. When the number is determined by taking two accounting numbers derived from the financial statements, it is termed as the accounting ratio.
Return on Equity
The Return on Equity (RoE) is a measure of the profitability of a business concerning the funds by its stockholders/shareholders. ROE is a metric used generally to determine how well the company utilizes its funds provided by the equity shareholders.
Topic Video
Question
What is the five firm concentration ratio?
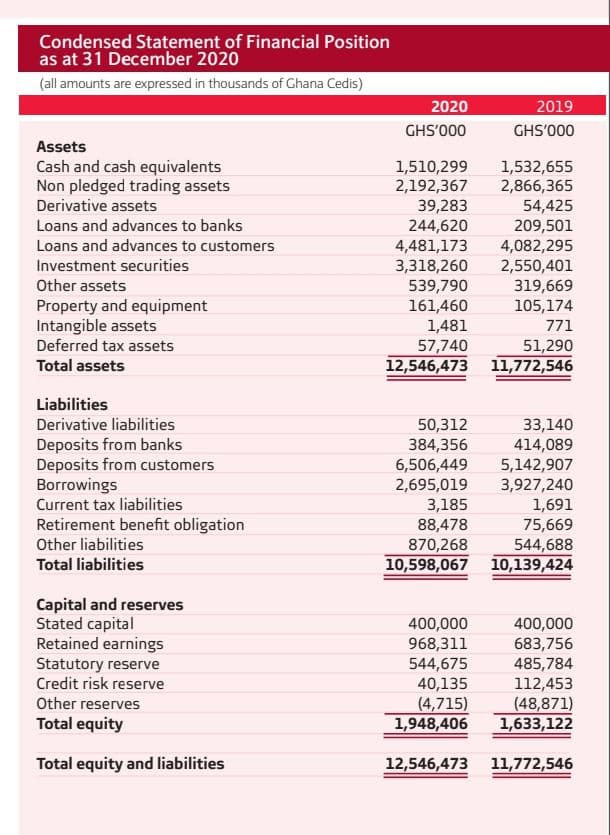
Transcribed Image Text:Condensed Statement of Financial Position
as at 31 December 2020
(all amounts are expressed in thousands of Ghana Cedis)
Assets
Cash and cash equivalents
Non pledged trading assets
Derivative assets
Loans and advances to banks
Loans and advances to customers
Investment securities
Other assets
Property and equipment
Intangible assets
Deferred tax assets
Total assets
Liabilities
Derivative liabilities
Deposits from banks
Deposits from customers
Borrowings
Current tax liabilities
Retirement benefit obligation
Other liabilities
Total liabilities
Capital and reserves
Stated capital
Retained earnings
Statutory reserve
Credit risk reserve
Other reserves
Total equity
Total equity and liabilities
2020
GHS'000
1,510,299 1,532,655
2,192,367
2,866,365
2019
GHS'000
39,283
54,425
244,620
209,501
4,481,173
4,082,295
3,318,260 2,550,401
539,790
319,669
161,460
105,174
1,481
771
57,740
51,290
12,546,473 11,772,546
50,312
33,140
384,356
414,089
6,506,449 5,142,907
2,695,019
3,927,240
3,185
1,691
88,478
75,669
870,268
544,688
10,598,067 10,139,424
400,000
968,311
544,675
40,135
(4,715)
1,948,406
400,000
683,756
485,784
112,453
(48,871)
1,633,122
12,546,473 11,772,546
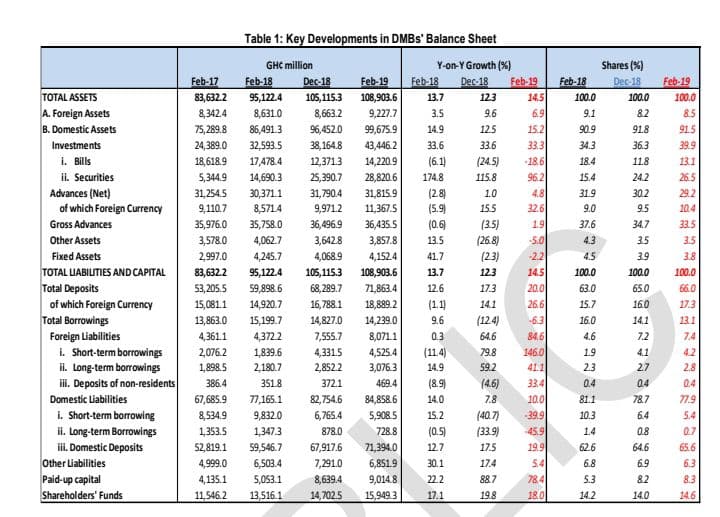
Transcribed Image Text:TOTAL ASSETS
A. Foreign Assets
B. Domestic Assets
Investments
i. Bills
ii. Securities
Advances (Net)
of which Foreign Currency
Gross Advances
Other Assets
Fixed Assets
TOTAL LIABILITIES AND CAPITAL
Total Deposits
of which Foreign Currency
Total Borrowings
Foreign Liabilities
i. Short-term borrowings
ii. Long-term borrowings
iii. Deposits of non-residents
Domestic Liabilities
i. Short-term borrowing
ii. Long-term Borrowings
iii. Domestic Deposits
Other Liabilities
Paid-up capital
Shareholders' Funds
Table 1: Key Developments in DMBS' Balance Sheet
Y-on-Y Growth (%)
Feb-17
83,632.2
95,122.4
Dec-18 Feb-19 Feb-18 Dec-18 Feb-19
105,115.3 108,903.6 13.7
3.5
8,342.4
8,631.0
8,663.2
9,227.7
75,289.8
86,491.3
96,452.0
99,675.9
14.9
24,389.0 32,593.5 38,164.8
43,446.2 33.6
(6.1)
18,618.9
5,344.9 14,690.3
31,254.5 30,371.1
9,110.7 8,571.4
35,976.0 35,758.0
4,062.7
GHC million
4,361.1
2,076.2
1,898.5
386.4
Feb-18
17,478.4 12,371.3 14,220.9
25,390.7 28,820.6
31,790.4 31,815.9
(2.8)
9,971.2 11,367.5
(5.9)
36,496.9 36,435.5
(0.6)
3,857.8
13.5
4,152.4
41.7
108,903.6
13.7
71,863.4
12.6
18,889.2 (1.1)
14,239.0
9.6
8,071.1
0.3
4,525.4 (11.4)
3,076.3
14.9
469.4
3,578.0
2,997.0
83,632.2
53,205.5 59,898.6
15,081.1 14,920.7
13,863.0
15,199.7
3,642.8
4,068.9
4,245.7
95,122.4 105,115.3
68,289.7
16,788.1
14,827.0
7,555.7
4,331.5
2,852.2
372.1
4,372.2
1,839.6
2,180.7
351.8
67,685.9
77,165.1
8,534.9
9,832.0
1,353.5
1,347.3
52,819.1 59,546.7
67,917.6
4,999.0
6,503.4
7,291.0
4,135.1
5,053.1
8,639.4
9,014.8
11,546.2
13,516.1 14,702.5 15,949.3
82,754.6 84,858.6
6,765.4
5,908.5
878.0
728.8
71,394.0
6,851.9
174.8
(8.9)
14.0
15.2
(0.5)
12.7
30.1
22.2
17.1
12.3
9.6
12.5
33.6
(24.5)
115.8
10
15.5
(3.5)
(26.8)
(2.3)
12.3
17.3
14.1
(12.4)
64.6
79.8
59.2
(4.6)
7.8
(40.7)
(33.9)
17.5
17.4
88.7
19.8
14.5
6.9
15.2
33.3
-18.6
96.2
4.8
32.6
1.9
-5.0
-2.2
14.5
20.0
26.6
-6.3
84.6
146.0
41.1
33.4
10.0
-39.9
-45.9
19.9
5.4
78.4
18.0
Feb-18
100.0
9.1
90.9
34.3
18.4
15.4
31.9
9.0
37.6
4.3
4.5
100.0
63.0
15.7
16.0
4.6
1.9
2.3
0.4
81.1
10.3
1.4
62.6
6.8
5.3
14.2
Shares (%)
Dec-18
100.0
8.2
91.8
36.3
11.8
24.2
30.2
9.5
34.7
3.5
3.9
100.0
65.0
16.0
14.1
7.2
41
2.7
0.4
78.7
6.4
0.8
64.6
6.9
8.2
14.0
Feb-19
100.0
8.5
91.5
39.9
13.1
26.5
29.2
10.4
33.5
3.5
3.8
100.0
66.0
17.3
13.1
7.4
4.2
2.8
0.4
77.9
5.4
0.7
ndy
65.6
6.3
8.3
14.6
Expert Solution
This question has been solved!
Explore an expertly crafted, step-by-step solution for a thorough understanding of key concepts.

This is a popular solution!

Trending now
This is a popular solution!

Step by step
Solved in 2 steps with 2 images

Knowledge Booster


Learn more about
Need a deep-dive on the concept behind this application? Look no further. Learn more about this topic, finance and related others by exploring similar questions and additional content below.Recommended textbooks for you
Financial Reporting, Financial Statement Analysis…
Finance
ISBN:
9781285190907
Author:
James M. Wahlen, Stephen P. Baginski, Mark Bradshaw
Publisher:
Cengage Learning

Financial Reporting, Financial Statement Analysis…
Finance
ISBN:
9781285190907
Author:
James M. Wahlen, Stephen P. Baginski, Mark Bradshaw
Publisher:
Cengage Learning