What is the probability that a randomly chosen person from this study was tall, given that they were underweight? (2 decimals)
What is the probability that a randomly chosen person from this study was tall, given that they were underweight? (2 decimals)

Chapter8: Sequences, Series,and Probability
Section8.7: Probability
Problem 11ECP: A manufacturer has determined that a machine averages one faulty unit for every 500 it produces....

Related questions
Question
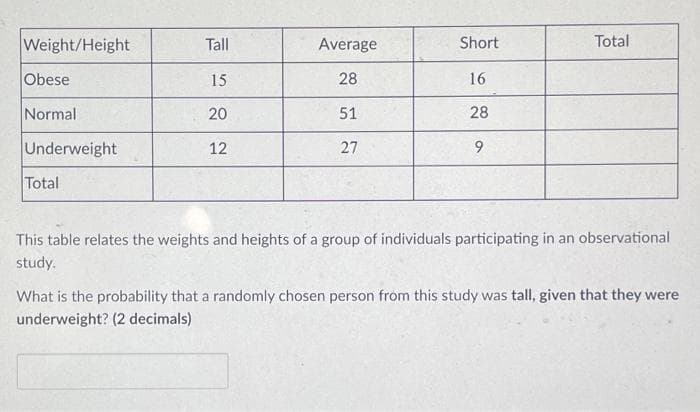
Transcribed Image Text:Weight/Height
Tall
Average
Short
Total
Obese
15
28
16
Normal
20
51
28
Underweight
12
27
9.
Total
This table relates the weights and heights of a group of individuals participating in an observational
study.
What is the probability that a randomly chosen person from this study was tall, given that they were
underweight? (2 decimals)
Expert Solution
This question has been solved!
Explore an expertly crafted, step-by-step solution for a thorough understanding of key concepts.

This is a popular solution!

Trending now
This is a popular solution!

Step by step
Solved in 2 steps with 2 images

Recommended textbooks for you