What is the range of the dot plot? * 21 22 23 24 25 26 27 28

Glencoe Algebra 1, Student Edition, 9780079039897, 0079039898, 2018
18th Edition
ISBN:9780079039897
Author:Carter
Publisher:Carter
Chapter10: Statistics
Section: Chapter Questions
Problem 8SGR

Related questions

Question
Transcribed Image Text:C Clever Portal
ACattle Drive/Frontier ppt
E 3.24.2021-Asynchronized Att x
E Mean, Median, Mode, and Ran x
E Emiy Navaro ca
< > C O
docs.google.com/forms/d/e/1FAlpQLSeNrLCt3CsZb-10ZYELwWbOHy7Mmt7Tb8PJBQfi2nUeeyQofA/viewform?hr_submission=Chgl3tyxzyASEA
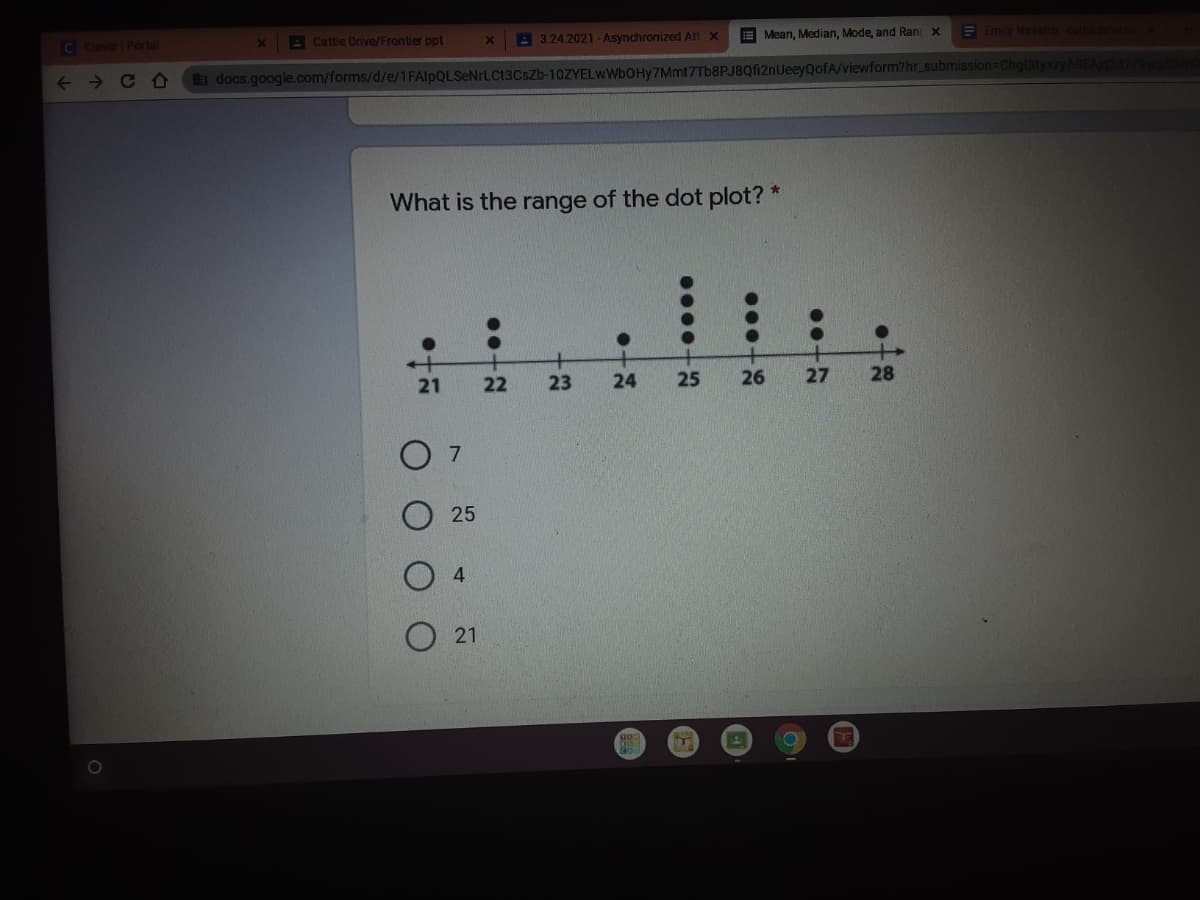
What is the range of the dot plot? *
21
22
23
24
25
26
27
28
O 7
25
21
Expert Solution
This question has been solved!
Explore an expertly crafted, step-by-step solution for a thorough understanding of key concepts.

This is a popular solution!
Need to find the range of the above data plot.
VIEWThe range is the difference of the largest number and smallest number on the axis of the data plot.
VIEWIn the provided data plot, the smallest number is 21 and the largest number is 28.
VIEWSo, the difference of smallest and largest number is 28-21=7.
VIEWTherefore, the range of the data plot is 7. The correct option is 7.
VIEW
Trending now
This is a popular solution!

Step by step
Solved in 5 steps

Knowledge Booster


Learn more about
Need a deep-dive on the concept behind this application? Look no further. Learn more about this topic, advanced-math and related others by exploring similar questions and additional content below.Recommended textbooks for you
Glencoe Algebra 1, Student Edition, 9780079039897…
Algebra
ISBN:
9780079039897
Author:
Carter
Publisher:
McGraw Hill

Holt Mcdougal Larson Pre-algebra: Student Edition…
Algebra
ISBN:
9780547587776
Author:
HOLT MCDOUGAL
Publisher:
HOLT MCDOUGAL
Glencoe Algebra 1, Student Edition, 9780079039897…
Algebra
ISBN:
9780079039897
Author:
Carter
Publisher:
McGraw Hill
Holt Mcdougal Larson Pre-algebra: Student Edition…
Algebra
ISBN:
9780547587776
Author:
HOLT MCDOUGAL
Publisher:
HOLT MCDOUGAL