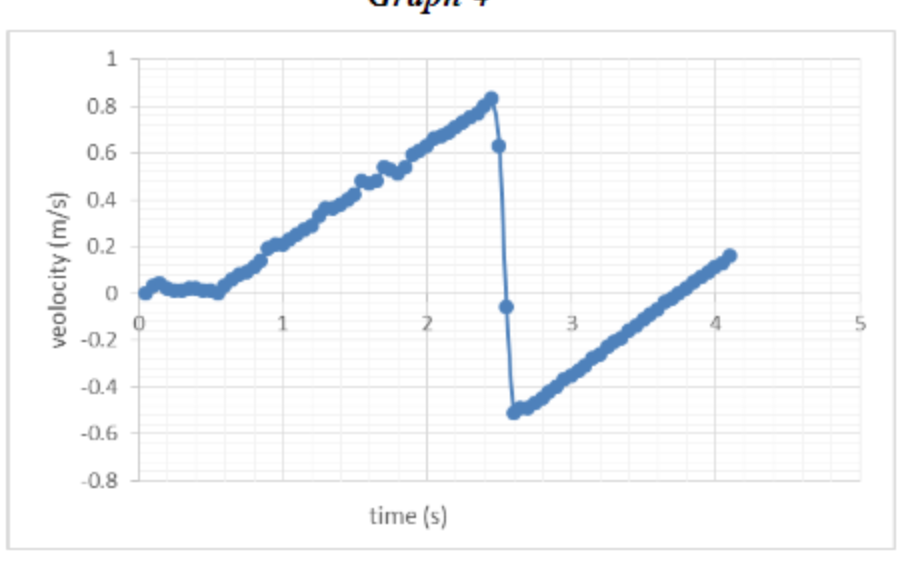
When given a velocity vs. time graph, draw the corresponding position vs. time and acceleration vs. time graphs. Graphs should include labels (including numerical values and correct units) for both the horizontal and vertical axes. The values don't have to be exactly right, but they should be relatively close. If possible, find the slope and apply it to a real life situation.
When given a velocity vs. time graph, draw the corresponding position vs. time and acceleration vs. time graphs. Graphs should include labels (including numerical values and correct units) for both the horizontal and vertical axes. The values don't have to be exactly right, but they should be relatively close. If possible, find the slope and apply it to a real life situation.

Related questions
Question
100%
When given a velocity vs. time graph, draw the corresponding position vs. time and acceleration vs. time graphs. Graphs should include labels (including numerical values and correct units) for both the horizontal and vertical axes. The values don't have to be exactly right, but they should be relatively close. If possible, find the slope and apply it to a real life situation.
Transcribed Image Text:0.8
0.6
0.4
0.2
-0.2
-0.4
-0.6
-0.8
time (s)
veolocity (m/s)
Expert Solution
This question has been solved!
Explore an expertly crafted, step-by-step solution for a thorough understanding of key concepts.

This is a popular solution!

Trending now
This is a popular solution!

Step by step
Solved in 2 steps with 2 images
