Which assumption below is not required for Hardy-Weinberg equilibrium? Random mating O Large population size O Large genome O Lack of mutations
Which assumption below is not required for Hardy-Weinberg equilibrium? Random mating O Large population size O Large genome O Lack of mutations

Biology: The Unity and Diversity of Life (MindTap Course List)
15th Edition
ISBN:9781337408332
Author:Cecie Starr, Ralph Taggart, Christine Evers, Lisa Starr
Publisher:Cecie Starr, Ralph Taggart, Christine Evers, Lisa Starr
Chapter44: Population Ecology
Section: Chapter Questions
Problem 1SQ: Most commonly, individuals of a population show a _______ distribution within their habitat. a....

Related questions

Topic Video
Question
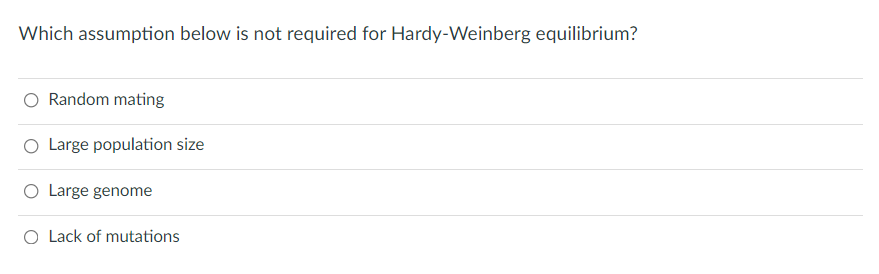
Transcribed Image Text:Which assumption below is not required for Hardy-Weinberg equilibrium?
O Random mating
Large population size
O Large genome
O Lack of mutations
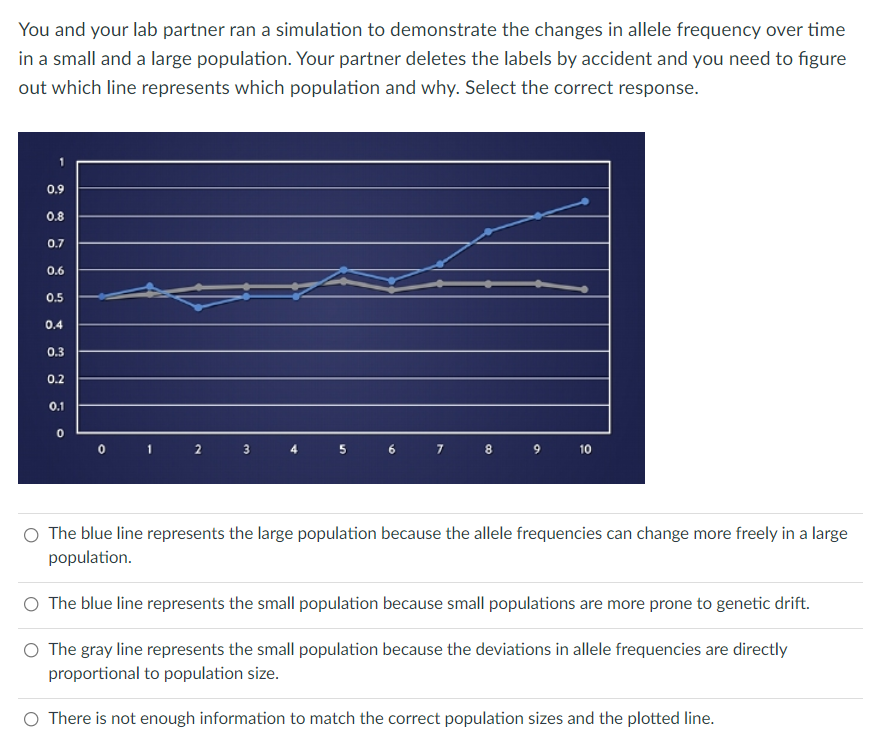
Transcribed Image Text:You and your lab partner ran a simulation to demonstrate the changes in allele frequency over time
in a small and a large population. Your partner deletes the labels by accident and you need to figure
out which line represents which population and why. Select the correct response.
0.9
0.8
0.7
0.6
0.5
0.4
0.3
0.2
0.1
0 1 2 3
6.
7 8
9 10
4 5
O The blue line represents the large population because the allele frequencies can change more freely in a large
population.
O The blue line represents the small population because small populations are more prone to genetic drift.
O The gray line represents the small population because the deviations in allele frequencies are directly
proportional to population size.
O There is not enough information to match the correct population sizes and the plotted line.
Expert Solution
This question has been solved!
Explore an expertly crafted, step-by-step solution for a thorough understanding of key concepts.

Step by step
Solved in 3 steps

Knowledge Booster


Learn more about
Need a deep-dive on the concept behind this application? Look no further. Learn more about this topic, biology and related others by exploring similar questions and additional content below.Recommended textbooks for you
Biology: The Unity and Diversity of Life (MindTap…
Biology
ISBN:
9781337408332
Author:
Cecie Starr, Ralph Taggart, Christine Evers, Lisa Starr
Publisher:
Cengage Learning
Biology: The Unity and Diversity of Life (MindTap…
Biology
ISBN:
9781337408332
Author:
Cecie Starr, Ralph Taggart, Christine Evers, Lisa Starr
Publisher:
Cengage Learning