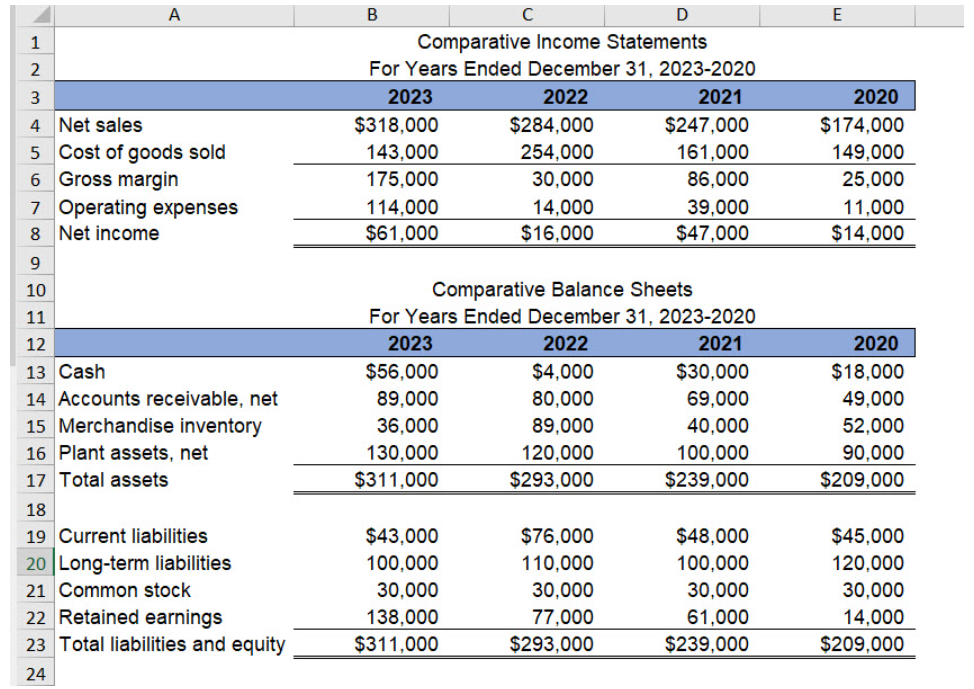
Which of the following formulas correctly calculates the current ratio for 2023? Hint: Remember that Excel uses the order of operations. PARENTHESES then EXPONENTS then MULTIPLICATION and DIVISION then ADDITION and SUBTRACTION. Use parentheses around any calculations in either the numerator or denominator. Multiple Choice: =+B13+B14+B15/B19 =+(B13+B14+B15)/B19 =+(B13+B14)/B19 =+(B13+B14+B15)/(B19+B20)
Which of the following formulas correctly calculates the current ratio for 2023? Hint: Remember that Excel uses the order of operations. PARENTHESES then EXPONENTS then MULTIPLICATION and DIVISION then ADDITION and SUBTRACTION. Use parentheses around any calculations in either the numerator or denominator. Multiple Choice: =+B13+B14+B15/B19 =+(B13+B14+B15)/B19 =+(B13+B14)/B19 =+(B13+B14+B15)/(B19+B20)

Survey of Accounting (Accounting I)
8th Edition
ISBN:9781305961883
Author:Carl Warren
Publisher:Carl Warren
Chapter9: Metric-analysis Of Financial Statements
Section: Chapter Questions
Problem 9.4.7P

Related questions
Question
Which of the following formulas correctly calculates the
-
=+B13+B14+B15/B19
=+(B13+B14+B15)/B19
=+(B13+B14)/B19
=+(B13+B14+B15)/(B19+B20)
Transcribed Image Text:1234
4
Net sales
A
5
6 Gross margin
Cost of goods sold
7 Operating expenses
8 Net income
9
10
11
12
13 Cash
14 Accounts receivable, net
15 Merchandise inventory
16 Plant assets, net
17 Total assets
18
19 Current liabilities
20 Long-term liabilities
21 Common stock
22 Retained earnings
23 Total liabilities and equity
24
D
Comparative Income Statements
For Years Ended December 31, 2023-2020
2022
2021
$284,000
$247,000
254,000
161,000
30,000
86,000
B
2023
$318,000
143,000
175.000
114,000
$61,000
C
2023
$56,000
89,000
36,000
130,000
$311,000
$43,000
100,000
30,000
138,000
$311,000
14,000
$16,000
Comparative Balance Sheets
For Years Ended December 31, 2023-2020
2022
2021
$4,000
$30,000
80,000
69,000
89,000
40,000
120,000
100,000
$293,000
$239,000
39,000
$47,000
$76,000
110,000
30,000
77,000
$293,000
$48,000
100,000
30,000
61,000
$239,000
E
2020
$174,000
149,000
25,000
11,000
$14,000
2020
$18,000
49,000
52,000
90,000
$209,000
$45,000
120,000
30,000
14,000
$209,000
Expert Solution
This question has been solved!
Explore an expertly crafted, step-by-step solution for a thorough understanding of key concepts.

Step by step
Solved in 2 steps

Knowledge Booster


Learn more about
Need a deep-dive on the concept behind this application? Look no further. Learn more about this topic, accounting and related others by exploring similar questions and additional content below.Recommended textbooks for you
Survey of Accounting (Accounting I)
Accounting
ISBN:
9781305961883
Author:
Carl Warren
Publisher:
Cengage Learning

Fundamentals of Financial Management (MindTap Cou…
Finance
ISBN:
9781337395250
Author:
Eugene F. Brigham, Joel F. Houston
Publisher:
Cengage Learning
Survey of Accounting (Accounting I)
Accounting
ISBN:
9781305961883
Author:
Carl Warren
Publisher:
Cengage Learning
Fundamentals of Financial Management (MindTap Cou…
Finance
ISBN:
9781337395250
Author:
Eugene F. Brigham, Joel F. Houston
Publisher:
Cengage Learning