Which of the following graphs could represent the kinetic energy of the mass as a function of time for one period after it is released from rest? Choose 1 answer: KE 0 T 2 KE И M •M M T 2 KE 0 T 2 T 2 A B K KE T T T T
Which of the following graphs could represent the kinetic energy of the mass as a function of time for one period after it is released from rest? Choose 1 answer: KE 0 T 2 KE И M •M M T 2 KE 0 T 2 T 2 A B K KE T T T T

Related questions
Question
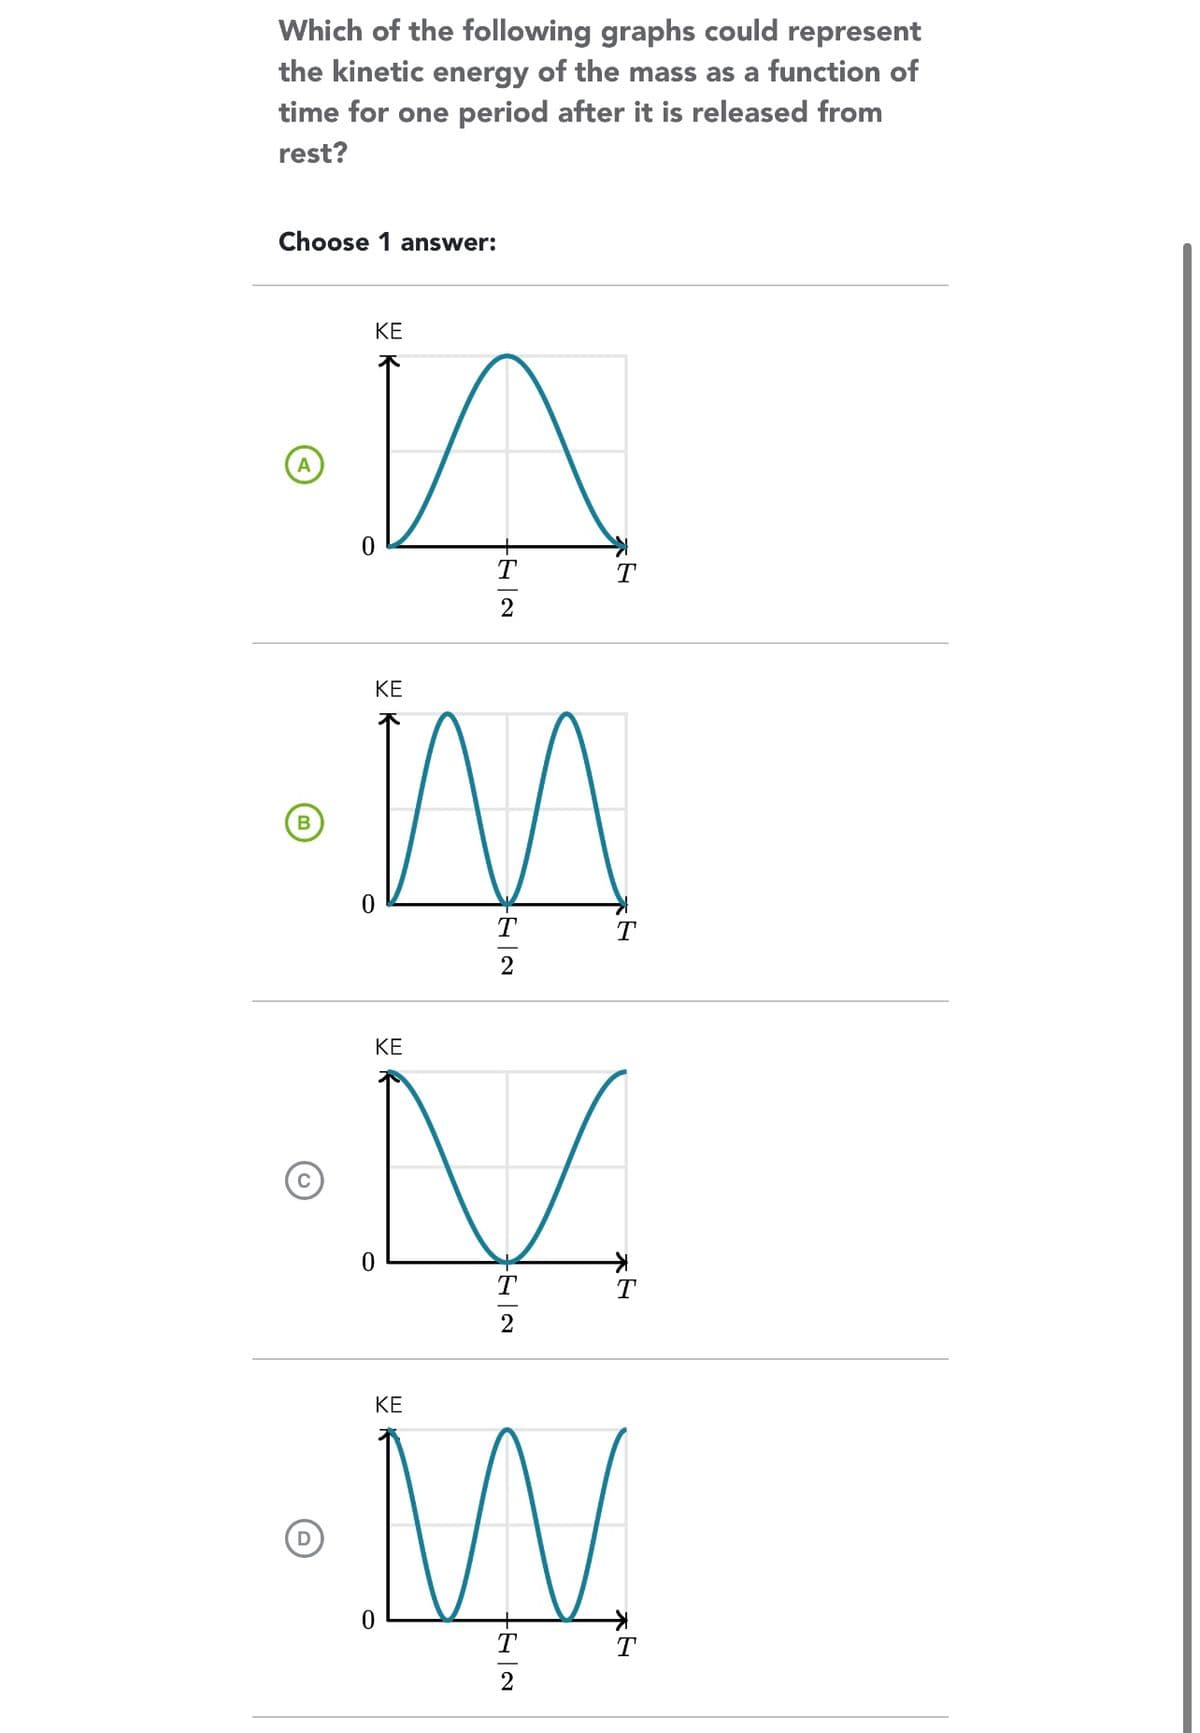
Transcribed Image Text:Which of the following graphs could represent
the kinetic energy of the mass as a function of
time for one period after it is released from
rest?
Choose 1 answer:
A
B
KE
И
M
M
T
T
T
2
0
KE
KE
ΚΕ
0
TEIN
2
2
T
T
M
T
2
T
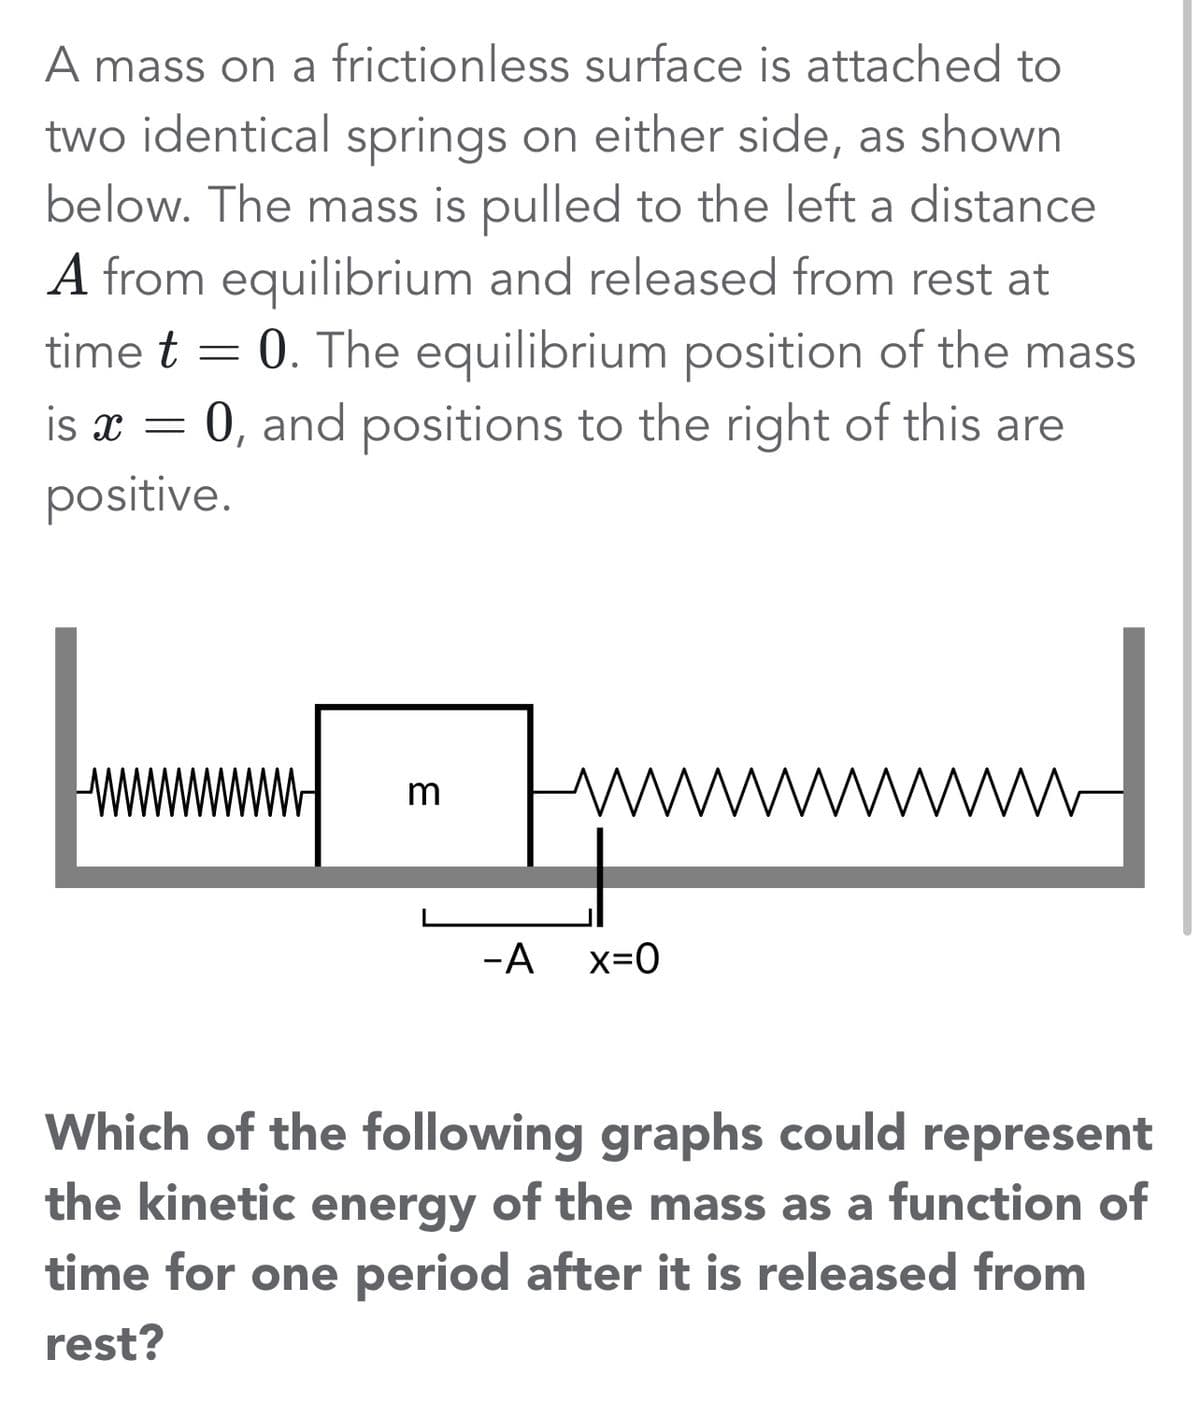
Transcribed Image Text:A mass on a frictionless surface is attached to
two identical springs on either side, as shown
below. The mass is pulled to the left a distance
A from equilibrium and released from rest at
time t = 0. The equilibrium position of the mass
is x = 0, and positions to the right of this are
positive.
-
E
-A x=0
Which of the following graphs could represent
the kinetic energy of the mass as a function of
time for one period after it is released from
rest?
Expert Solution
This question has been solved!
Explore an expertly crafted, step-by-step solution for a thorough understanding of key concepts.

Step by step
Solved in 2 steps with 2 images
